This is an IELTS writing task 1 sample answer essay from the new IELTS Cambridge 18 book of past tests on the topic of the population in four Asian countries from 1970 to 2040.
You can also sign up for my full EBooks below:
Dave
IELTS Cambridge 18: Population in Four Asian Countries
The graph gives information about the percentage of the population if four different Asian countries living in cities between 1970 and 2020 with additional predictions for 2030 and 2040.
Summarize the information by selecting and reporting the main features and making comparisons where relevant.
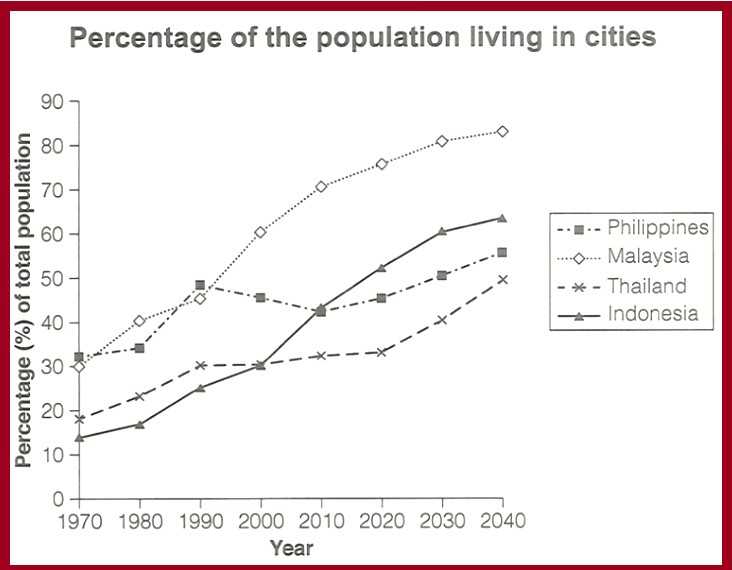
The line chart delineates population trends as they relate to urban residency in four Asian countries starting in 1970 with projections through 2040. Looking from an overall perspective, it is readily apparent that living in urban areas will increase in each nation, particularly Malaysia and the Philippines. By the end of the period, Malaysia will have by far the greatest proportion of their population living in cities.
In 1970, the percentages for urban residents in the Philippines and Malaysia were nearly equal (31% and 30% for each), similar to the data for Thailand and Indonesia (19% and 12%, respectively). Over the next twenty years, Malaysia’s percentage rose and fluctuated, switching relative positions with the Philippines around the 40% marker before beginning a dramatic surge in 1990 that is anticipated to continue and plateau at just over 80% by 2040. The Philippines, in contrast, declined moderately after 1980, though this figure will likely recover and end at a high of above 50% in 2040.
The statistics for urban residency in Indonesia have grown considerably, overtaking Thailand in 2000 (at 28%) and the Philippines in 2010 (at 42%). This pattern is projected to persist with the final figure the second highest among all nations at 55%. Lastly, Thailand has experienced the most gradual and consistent increase to reach approximately 30% in the present day, with a more rapid rise to over 40% expected over the next 17 years.
Analysis
1. The line chart delineates population trends as they relate to urban residency in four Asian countries starting in 1970 with projections through 2040. 2. Looking from an overall perspective, it is readily apparent that living in urban areas will increase in each nation, particularly Malaysia and the Philippines. 3. By the end of the period, Malaysia will have by far the greatest proportion of their population living in cities.
- Paraphrase what the bar chart shows.
- Write a clear overview summarising the differences and the overall trend.
- This one is a little complex so it needs a second sentence for the overview.
1. In 1970, the percentages for urban residents in the Philippines and Malaysia were nearly equal (31% and 30% for each), similar to the data for Thailand and Indonesia (19% and 12%, respectively). 2. Over the next twenty years, Malaysia’s percentage rose and fluctuated, switching relative positions with the Philippines around the 40% marker before beginning a dramatic surge in 1990 that is anticipated to continue and plateau at just over 80% by 2040. 3. The Philippines, in contrast, declined moderately after 1980, though this figure will likely recover and end at a high of above 50% in 2040.
- Begin writing about the data for the first categories.
- Compare between each sentence.
- Add as much detail as possible.
1. The statistics for urban residency in Indonesia have grown considerably, overtaking Thailand in 2000 (at 28%) and the Philippines in 2010 (at 42%). 2. This pattern is projected to persist with the final figure the second highest among all nations at 55%. 3. Lastly, Thailand has experienced the most gradual and consistent increase to reach approximately 30% in the present day, with a more rapid rise to over 40% expected over the next 17 years.
- Write about the final other parts of the graph – include everything!
- Compare the categories.
- This one is a bit long, but better than being too short!
Vocabulary
The line chart delineates population trends as they relate to urban residency in four Asian countries starting in 1970 with projections through 2040. Looking from an overall perspective, it is readily apparent that living in urban areas will increase in each nation, particularly Malaysia and the Philippines. By the end of the period, Malaysia will have by far the greatest proportion of their population living in cities.
In 1970, the percentages for urban residents in the Philippines and Malaysia were nearly equal (31% and 30% for each), similar to the data for Thailand and Indonesia (19% and 12%, respectively). Over the next twenty years, Malaysia’s percentage rose and fluctuated, switching relative positions with the Philippines around the 40% marker before beginning a dramatic surge in 1990 that is anticipated to continue and plateau at just over 80% by 2040. The Philippines, in contrast, declined moderately after 1980, though this figure will likely recover and end at a high of above 50% in 2040.
The statistics for urban residency in Indonesia have grown considerably, overtaking Thailand in 2000 (at 28%) and the Philippines in 2010 (at 42%). This pattern is projected to persist with the final figure the second highest among all nations at 55%. Lastly, Thailand has experienced the most gradual and consistent increase to reach approximately 30% in the present day, with a more rapid rise to over 40% expected over the next 17 years.
Answers
For extra practice, write an antonym (opposite word) on a piece of paper to help you remember the new vocabulary:
delineates shows
population trends the pattern for the number of people in a country
relate to concern
urban residency people living in cities
starting in beginning
with projections through showing predictions for the future
Looking from an overall perspective, it is readily apparent that overall
urban areas cities
particularly especially
By the end of the period at the end of the time surveyed
by far the greatest proportion of their population living in cities a lot higher than the percentages for people living in cities in other countries
nearly equal about the same
respectively in turn, for each
rose grew
fluctuated was erratic, not stable
switching relative positions changing which one is leading
marker before beginning a dramatic surge in level prior to starting to grow quickly
anticipated to continue and plateau at just over predicted to keep going and level off at above
in contrast in comparison
declined moderately after went down a bit after
though however
will likely recover will probably come back up
end at a high of above finish at a high point over
statistics numbers
urban residency people living in cities
grown considerably increased a lot
overtaking getting bigger than
pattern trend
projected to persist predicted to continue
the final figure the ending number
among all covering all the countries
Lastly finally
experienced witnessed, underwent
most gradual and consistent increase slowest and steadiest rise
reach approximately get to about
more rapid rise fastest increase
expected over the next predicted in the future to
Pronunciation
Practice saying the vocabulary below and use this tip about Google voice search:
dɪˈlɪnɪeɪts
ˌpɒpjəˈleɪʃᵊn trɛndz
rɪˈleɪt tuː
ˈɜːbən ˈrɛzɪdənsi
ˈstɑːtɪŋ ɪn
wɪð prəˈʤɛkʃᵊnz θruː
ˈlʊkɪŋ frɒm ən ˈəʊvərɔːl pəˈspɛktɪv, ɪt ɪz ˈrɛdɪli əˈpærənt ðæt
ˈɜːbən ˈeərɪəz
pəˈtɪkjələli
baɪ ði ɛnd ɒv ðə ˈpɪərɪəd
baɪ fɑː ðə ˈɡreɪtɪst prəˈpɔːʃᵊn ɒv ðeə ˌpɒpjəˈleɪʃᵊn ˈlɪvɪŋ ɪn ˈsɪtiz
ˈnɪəli ˈiːkwəl
rɪsˈpɛktɪvli
rəʊz
ˈflʌkʧueɪtɪd
ˈswɪʧɪŋ ˈrɛlətɪv pəˈzɪʃᵊnz
ˈmɑːkə bɪˈfɔː bɪˈɡɪnɪŋ ə drəˈmætɪk sɜːʤ ɪn
ænˈtɪsɪpeɪtɪd tuː kənˈtɪnjuː ænd ˈplætəʊ æt ʤʌst ˈəʊvə
ɪn ˈkɒntrɑːst
dɪˈklaɪnd ˈmɒdərɪtli ˈɑːftə
ðəʊ
wɪl ˈlaɪkli rɪˈkʌvə
ɛnd æt ə haɪ ɒv əˈbʌv
stəˈtɪstɪks
ˈɜːbən ˈrɛzɪdənsi
ɡrəʊn kənˈsɪdərəbᵊli
ˌəʊvəˈteɪkɪŋ
ˈpætən
prəˈʤɛktɪd tuː pəˈsɪst
ðə ˈfaɪnl ˈfɪɡə
əˈmʌŋ ɔːl
ˈlɑːstli
ɪksˈpɪərɪənst
məʊst ˈɡræʤuəl ænd kənˈsɪstənt ˈɪnkriːs
riːʧ əˈprɒksɪmɪtli
mɔː ˈræpɪd raɪz
ɪksˈpɛktɪd ˈəʊvə ðə nɛkst
Vocabulary Practice
The line chart d____________s p__________________s as they r_________o u_______________y in four Asian countries s____________n 1970 w___________________h 2040. L______________________________________________________________t living in u___________s will increase in each nation, p__________y Malaysia and the Philippines. B________________d, Malaysia will have b___________________________________________________________________________s.
In 1970, the percentages for urban residents in the Philippines and Malaysia were n__________l (31% and 30% for each), similar to the data for Thailand and Indonesia (19% and 12%, r_________y). Over the next twenty years, Malaysia’s percentage r____e and f____________d, s__________________s with the Philippines around the 40% m_______________________________________n 1990 that is a___________________________________________r 80% by 2040. The Philippines, i_______________t, d_____________________________r 1980, t________h this figure w__________________r and e______________________e 50% in 2040.
The s____________s for u________________y in Indonesia have g____________________y, o___________g Thailand in 2000 (at 28%) and the Philippines in 2010 (at 42%). This p___________n is p_________________t with t_____________________e the second highest a____________l nations at 55%. L______y, Thailand has e______________d the m_________________________________e to r___________________y 30% in the present day, with a m________________e to over 40% e___________________t 17 years.
Listening Practice
Reading Practice
https://a-z-animals.com/blog/discover-the-most-populated-cities-in-the-world/
Speaking Practice
Your Home Nation/Country
- Where are you from?
- What do you like the most about your country?
- Where would you like to live in your country?
- Are people in your country patriotic?


0 Comments