This is an IELTS writing task 2 sample answer essay from the newly released Cambridge 15 on the topic of buying coffee and tea in 5 Australian cities.
Be sure to sign up for my Patreon.com/HowtodoIELTS for my exclusive Ebooks and other materials!
Here are my other IELTS Cambridge 15 essays:
Writing Task 1 Tests 1-4:
Writing Task 2 Tests 1-4
IELTS Writing Task 2 Sample Answer Essay Cambridge 15: Owning or Renting a Home (IELTS Cambridge 15)
Dave
IELTS Writing Task 1 Sample Answer Essay Cambridge 15: Coffee and Tea Buying and Drinking Habits
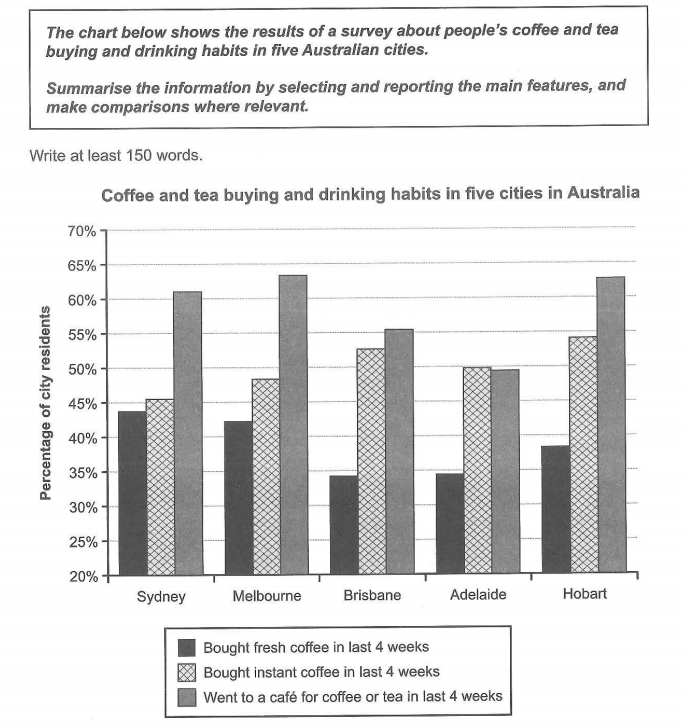
The bar chart details drinking habits in 5 Australian cities as they relate to coffee and tea over the last 4 weeks. Overall, more than half the population in all cities except Adelaide went to a cafe for coffee or tea, while buying instant coffee was also popular and buying fresh coffee generally less common.
Looking first of all at going to cafes, it was most characteristic of Melbourne and Hobart at 64% and 63%, respectively. Sydney was comparably high at just over 60%, followed by Brisbane at over 55%, and finally Adelaide at under 50%. Adelaide was the only city where people bought more instant coffee by a slight margin (50%). In Hobart, instant coffee purchases stood at 54%, ahead of Brisbane at 52%, Melbourne at 48% and lastly Sydney (just over 45%).
Stocking up on fresh coffee was below 45% for all cities. It was most common in Sydney (44%) and Melbourne (42%). Hobart was next at 39%, and Adelaide and Brisbane were much lower and nearly level at around 34%.
Analysis
1. The bar chart details drinking habits in 5 Australian cities as they relate to coffee and tea over the last 4 weeks. 2. Overall, more than half the population in all cities except Adelaide went to a cafe for coffee or tea, while buying instant coffee was also popular and buying fresh coffee generally less common.
- Paraphrase the overall essay topic.
- Write a general overview including all categories. Learn more about your overview here.
1. Looking first of all at going to cafes, it was most characteristic of Melbourne and Hobart at 64% and 63%, respectively. 2. Sydney was comparably high at just over 60%, followed by Brisbane at over 55%, and finally Adelaide at under 50%. 3. Adelaide was the only city where people bought more instant coffee by a slight margin (50%). 4. In Hobart, instant coffee purchases stood at 54%, ahead of Brisbane at 52%, Melbourne at 48% and lastly Sydney (just over 45%).
- Begin writing about the data. I start with the highest areas but you can start with any part.
- Include all the data.
- Compare with any exceptions.
- Continue with the data – don’t miss any areas!
1. Stocking up on fresh coffee was below 45% for all cities. 2. It was most common in Sydney (44%) and Melbourne (42%). 3. Hobart was next at 39%, and Adelaide and Brisbane were much lower and nearly level at around 34%.
- Move on to the next category.
- Always compare and group the data.
- Conclude with all the data.
Vocabulary
What do the words in bold below mean?
The bar chart details drinking habits in 5 Australian cities as they relate to coffee and tea over the last 4 weeks. Overall, more than half the population in all cities except Adelaide went to a cafe for coffee or tea, while buying instant coffee was also popular and buying fresh coffee generally less common.
Looking first of all at going to cafes, it was most characteristic of Melbourne and Hobart at 64% and 63%, respectively. Sydney was comparably high at just over 60%, followed by Brisbane at over 55%, and finally Adelaide at under 50%. Adelaide was the only city where people bought more instant coffee by a slight margin (50%). In Hobart, instant coffee purchases stood at 54%, ahead of Brisbane at 52%, Melbourne at 48% and lastly Sydney (just over 45%).
Stocking up on fresh coffee was below 45% for all cities. It was most common in Sydney (44%) and Melbourne (42%). Hobart was next at 39%, and Adelaide and Brisbane were much lower and nearly level at around 34%.
Answers
drinking habits how people drink
relate to have to do with
more than half over 50%
instant coffee coffee that you just add and mix
generally less common overall not as popular
looking first of all at starting with
most characteristic of most popular in
respectively in turn
comparably high relatedly large
followed by precedes
over above
finally at last
under less than
slight margin just a little bit
stood at was at
ahead of preceding
lastly finally
just over a little above
stocking up buying
below under
much lower a lot less
nearly level about equal
around about
Pronunciation
Listen and repeat:
ˈdrɪŋkɪŋ ˈhæbɪts
rɪˈleɪt tuː
mɔː ðæn hɑːf
ˈɪnstənt ˈkɒfi
ˈʤɛnərəli lɛs ˈkɒmən
ˈlʊkɪŋ fɜːst ɒv ɔːl æt
məʊst ˌkærɪktəˈrɪstɪk ɒv
rɪsˈpɛktɪvli
ˈkɒmpərəbli haɪ
ˈfɒləʊd baɪ
ˈəʊvə
ˈfaɪnəli
ˈʌndə
slaɪt ˈmɑːʤɪn
stʊd æt
əˈhɛd ɒv
ˈlɑːstli
ʤʌst ˈəʊvə
ˈstɒkɪŋ ʌp
bɪˈləʊ
mʌʧ ˈləʊə
ˈnɪəli ˈlɛvl
əˈraʊnd
Vocabulary Practice
Remember and fill in the blanks:
The bar chart details d___________________s in 5 Australian cities as they r____________o coffee and tea over the last 4 weeks. Overall, m________________f the population in all cities except Adelaide went to a cafe for coffee or tea, while buying i__________________e was also popular and buying fresh coffee g_______________________n.
L__________________________t going to cafes, it was m____________________________f Melbourne and Hobart at 64% and 63%, r_________________y. Sydney was c___________________h at just over 60%, f______________________y Brisbane at o_______r 55%, and f_________y Adelaide at u_________r 50%. Adelaide was the only city where people bought more instant coffee by a s________________n (50%). In Hobart, instant coffee purchases s___________t 54%, a___________f Brisbane at 52%, Melbourne at 48% and l_________y Sydney (j___________r 45%).
S_________________p on fresh coffee was b__________w 45% for all cities. It was most common in Sydney (44%) and Melbourne (42%). Hobart was next at 39%, and Adelaide and Brisbane were m______________r and n____________l at a______________d 34%.
Listen and check:
Listening Practice
Learn if you are drinking coffee the right way below:
Reading Practice
Read here from a medical website about the health benefits and risks of coffee:
Speaking Practice
Practice with the following real questions from IELTS speaking:
Coffee or Tea
Do you drink coffee or tea?
When did you last drink coffee or tea?
Is coffee or tea more popular in your country?
Which would you offer to visitors who came to your home?
Real IELTS Speaking Exam
Writing Practice
Write about the following graph then check with my sample answer.
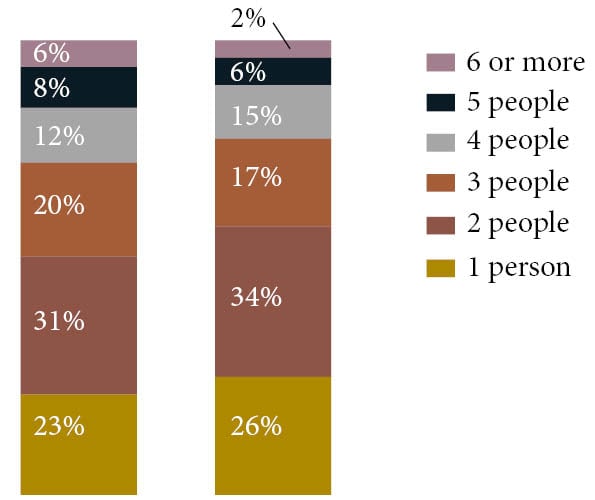
The chart compares the number of people per household by percentage in the UK in 1981 and 2001.


The bar graph depicts people’s preference for coffee and tea in five different cities in Australia over the last 4 weeks. Overall, it is clear that the leading practice of Australians to buy coffee or tea are going to a cafe. Also, buying instant coffee was a popular option while buying fresh coffee was less common.
Coffee and tea from a cafe are the most in-demand for people in Melbourne, Hobart, and Sydney, with a proportion of around 63%, 62%, and 61%, respectively. In Brisbane similarly, the cafe is their most preferred way to drink coffee or tea, at 56%. However, in Adelaide, buying instant coffee was their popular habit, at exactly half of their residents were fond of this, and just a difference of very small proportion from the cafe. This percentage were almost the same for people who bought instant coffee in Hobart, Brisbane, Melbourne, and Sydney, at about 54%, 53%, 48%, and 46%, respectively.
The proportion of residents buying fresh coffee for 5 cities were under half. The people from Sydney and Melbourne were the top consumers of this type of coffee, stood at 44% for the former, and 42% for the latter. These percentages were followed by Hobart at 38%, Adelaine at 34%, and lastly Brisbane at just 33%.
Well done Jessica!
preferences… for Australians was… when going to… with proportions at around… with exactly half of all residents doing this… standing at…
Great!
Since no dates are given in the writing task, shouldn’t the tenses be ‘present’?
i think we should use past tense because you can see below the graph it was written “in last 4 weeks”, but it’s just my opinion
Yes, but since the last 4 weeks are a finished period in the past it is best to use the past. A combination would be ok too or more present perfect for an unclear time.
Sir my overview….
Overall, it is clearly apparent that across the five cities in the last four weeks with the exception of Adelaide had the highest increase in population when going to the cafe to buy coffee or tea. Furthermore, instant coffee was also a popular option, while buying fresh coffee was less common.
Yes – great, you fully covered the trend and had some ranking – keep it up!
Sorry what do you mean “had some ranking”
I mean that you included where each one ranks – 1st, 2nd, etc. at least a little bit which is good!
I think this should be the conclusion (?)
we should use present perfect
Why is that Zara?
We should add a conclusion part, am I right?
No need for a conclusion, Tony!
Given is a chart illustrated collected information about coffee and tea buying and drinking custom in five divergent cities of Australia.Overall,it is precise that Melbourne represented the highest rate on going to a cafe while Sydney showed the least rate on buying instant coffee.
The pointer of buying fresh coffee over the last four weeks indicated that the predominant city was Sydney at just under 45% whereas Brisbane registered a minimal rate with around 34%.The figure for buying instant coffee over the last four weeks presented bigger amount than first trend.On this figure Hobart was a dominant pointer at nearly 55% and Sydney highlighted much less proportion than other cities with just under 45%.
If we look at the last category which going to cafe. It was upper than 55% for all cities without Adelaide.Melbourne presented the largest index with just upper 65%.Sydney at 62%. Brisbane at 55%. Hobart at around 63%. Finally Adelaide showed just below 50%.
Please check my essay and i hope you will write my informal score
Great, Diyorbek!
You need to cover all areas for your overview or you will automatically get band 5 for task achievement, unfortunately.
Can you rewrite that sentence?
For scores, you can sign up here: course.howtodoielts.com/band-scores-corrections
The bar graph illustrates the results of a survey about buying and drinking habits of coffee and tea by the people of Australia in five major cities.
It can be seen that the purchasing of tea and coffee is more habitual in Sydney than other cities. People of Adelaide and Brisbane are not fond of buying fresh coffee from stores.
To begin with, 43% of citizens of Sydney in the last 4 weeks prefer buying fresh coffee while 45% order instant coffee. Relatively, more than 60% population of the city likes to go to a café for coffee or tea in the last month. The numbers are substantially similar to Melbourne as well, with a slightly more percentage of citizens going to a café.
Brisbane and Adelaide have shown similar patterns of people with almost similar habits of drinking in the last 4 weeks. There is a drastic fall down in the percentages. Comparatively, Hobart’s people are more indigenous in hanging out in cafés for a cup of tea or coffee.
The given illustration depicts information about the results of investigation about consumption of tea and coffee during last month in different five Astralian cities.
Overall, more than half population of Australia are preferred to go out to a cafe for coffee and tea, while buying instant coffee also highly demanded in three cities, however, buying fresh coffee was generally less common.
As it is presented in the bar chart the highest percentages of city residents who more chose to go out a cafe for drinking a coffee were Sydney, Melbroune and Hobard that compounded over the 60%.
The data suggest that, the consumption of instant coffee is compounded also a high percentages around the country, namely in Hobartan, Brisbane and Adelaide and comprised of over a half 50%. In comparison, these indicators seem to be unversely correlated in Melbourourne and Sydney that constitutes just under a half 50%.
In terms of purchasing of fresh coffee was less common in many Australian cities such as Brisbane and Adelide that compounded the identical indicators nearly over one-third percent 34%. In contrast, the residents of Sydney and Melbroune have a high indicators in consumption of fresh coffee and made up approximately 44%.
The bar chart details the percentage of people in five Australian cities buying coffee and tea.
Overall, people who bought fresh coffee in the last 4 weeks are slightly fewer than those who bought instant coffee. However, people went to a cafe for coffee or tea generally the most in all areas compared to others.
In all areas, the fewest people were willing to spend money on fresh coffee. Both Brisbane and Adelaide illustrate a similar trend. That is, less than 35%, which is the fewest, of people bought fresh one; the figure is significantly less than that of other categories.
In both Melbourne and Hobart, around 63% of people explored the cafe for beverages, making the percentage of instant coffee in a second rank. Although the chart depicts that generally, most people went to a cafe in almost every city, residents bought instant coffee slightly more often than those for cafes in only one region called Adelaide.
The bar chart details the results of a survey based on people’s preferences for buying and drinking habits in five Australian cities. Every city has its own drinking habits regarding these two warm beverages.
Looking from an overall perspective, more than half of Australian residents went to a cafe for coffee or tea in the last four weeks. Meanwhile, buying instant coffee was also common in Australian cities. Striking changes illustrate that in the last four weeks, the smallest percentage was buying fresh coffee.
The city with the highest percentage of people buying fresh coffee is Sydney, with roughly 44 percent. Brisbane, on the other hand, has the lowest percentage of people buying fresh coffee in the recent four weeks, at 34%. Hobart, at 54 percent, is the city with the highest percentage of bought instant coffee. Sydney had the lowest percentage of people buying instant coffee during the study period, at 45 percent.
Melbourne has the highest percentage of residents who go to a cafe’, approximately 64%. Adelaide is the city that has the smallest percentage of its residents who have the habit of going to a café in the last four weeks, at 50%.
Good writing, Tomicka!
Nice overview and inclusion of the data – be careful with grammatical accuracy when writing about the data.
The bar graph illustrates Australians’ buying and drinking habits of tea and coffee. The data is derived from a survey in five metropolises in Australia.
Overall, going to a cafe is by far the most popular choice in almost all cities, while buying fresh coffee is the least preferred.
In all the cities, people didn’t prefer buying a coffee that is freshly made, which is depicted by the fact that only 44% of surveyors in Sydney said they had bought such a coffee in the past 4 weeks, highest among all the cities. Instant coffee was a far more lucrative choice, with as many as 54% of people in Hobart preferring it. However, nothing was as popular as going out to a cafe and drinking coffee over there. As many as 64% of people Melbourne and Hobart reported, with at least half in every city.
The general trend of the data, which is from fresh to instant to going out, was not followed in Adelaide. Here, people had no preference between going out and buying instant coffee, which is reflected by about half the people reporting both ways.
The given bar chart illustrates information about the habits of 5 Australian citizens purchasing and drinking coffee and tea in the last four weeks.
Overall, it is evident that the total amount of citizens was more willing to consume coffee or tea in a café rather than buying fresh or instant coffee during the last four weeks, except Adelaide. Among cities, most residents have coffee or tea in a café in Melbourne.
More than 40% of residents bought fresh coffee last month in Sydney and Melbourne, at 44% and 42%, respectively. While more than 35% of citizens purchased fresh coffee in the previous four weeks, there is a constant percentage of people living in Brisbane and Adelaide, less than 35%.
More than 45% of residents in all cities enjoyed instant coffee within the last four weeks. The highest proportion in Hobart is drinking instant coffee, with roundly 54%, while approximately 53% national in Brisbane consumed it. The consumption of instant coffee is a half population in Adelaide. Less than 50% population in Sydney and Melbourne enjoyed instant coffee.
More than 60% population drinks coffee or tea in 3 cities, including Melbourne, Hobart and Sydney. They are 64%, 63% and 61%, separately. While drinking in a café is slightly higher than enjoying instant coffee in Brisbane, Adelaide is the only city in which citizens prefer instant coffee rather than revelling in a café.