This is an IELTS writing task 1 sample answer essay on the topic of at which age women in Australia had their first child from the real IELTS exam.
Find my full IELTS Ebooks here.
You can find line charts here and bar charts here.
Dave
IELTS Task 1 Essay: Women in Australia – First Child
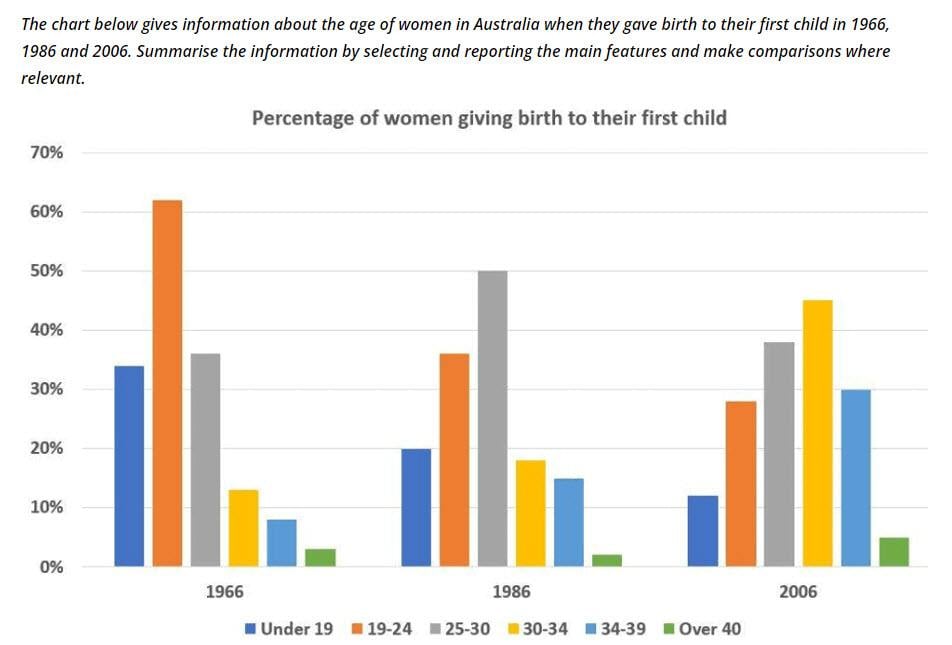
The bar chart details when women in Australia had their first child from 1966 to 2006. Looking from an overall perspective, it is readily apparent that women in the past tended to have their first child earlier in life, especially very young women. Having a child in one’s 30s became much more common, though after one’s 30s it remained relatively rare.
In 1966, 33% of women had their first child under the age of 19. This figure dropped precipitously to reach 11% by 2006. The data for women 19-24 underwent a similar drop, falling from 62% to 50% and finally 28%.
In contrast, 36% of women were 19-24 years old when they first gave birth in 1966 and this number then rose to 50% in 1986 before dropping back to just above the original figure to end the period. The largest rise occurred in the 30-34 age range which more than quadrupled (11% to 18% to 45%). This paralleled the growth for ages 34-39, nearly doubling every 20 years from 9% to 17% and lastly 30%. Finally, there was little change for women over 40 despite marginal growth from 3% to 5%.
Analysis
1. The bar chart details when women in Australia had their first child from 1966 to 2006. 2. Looking from an overall perspective, it is readily apparent that women in the past tended to have their first child earlier in life, especially very young women. 3. Having a child in one’s 30s became much more common, though after one’s 30s it remained relatively rare.
- Paraphrase what the table shows.
- Write a clear overview summarising the differences.
- You might need another sentence for your overview.
1. In 1966, 33% of women had their first child under the age of 19. This figure dropped precipitously to reach 11% by 2006. 2. The data for women 19-24 underwent a similar drop, falling from 62% to 50% and finally 28%.
- Begin writing about the data for the first categories.
- Make sure you compare as much as possible.
1. In contrast, 36% of women were 19-24 years old when they first gave birth in 1966 and this number then rose to 50% in 1986 before dropping back to just above the original figure to end the period. 2. The largest rise occurred in the 30-34 age range which more than quadrupled (11% to 18% to 45%). 3. This paralleled the growth for ages 34-39, nearly doubling every 20 years from 9% to 17% and lastly 30%. 4. Finally, there was little change for women over 40 despite marginal growth from 3% to 5%.
- Write about the final, other parts of the graph – include everything!
- Compare the categories.
Vocabulary
What do the words in bold below mean? Take some notes on a piece of paper to aid your memory:
The bar chart details when women in Australia had their first child from 1966 to 2006. Looking from an overall perspective, it is readily apparent that women in the past tended to have their first child earlier in life, especially very young women. Having a child in one’s 30s became much more common, though after one’s 30s it remained relatively rare.
In 1966, 33% of women had their first child under the age of 19. This figure dropped precipitously to reach 11% by 2006. The data for women 19-24 underwent a similar drop, falling from 62% to 50% and finally 28%.
In contrast, 36% of women were 19-24 years old when they first gave birth in 1966 and this number then rose to 50% in 1986 before dropping back to just above the original figure to end the period. The largest rise occurred in the 30-34 age range which more than quadrupled (11% to 18% to 45%). This paralleled the growth for ages 34-39, nearly doubling every 20 years from 9% to 17% and lastly 30%. Finally, there was little change for women over 40 despite marginal growth from 3% to 5%.
Answers
Try to write down or think of an antonym/opposite word for further practice:
details shows
first child first kid
Looking from an overall perspective, it is readily apparent that overall
in the past formerly
tended to usually
earlier in life when younger
especially in particular
common happened a lot
remained relatively rare stayed not that common
under less than
figure dropped precipitously number fell a lot
reach got to
data numbers
underwent a similar drop also fell
falling from … to going down to
finally lastly
in contrast however
first gave birth had their first child
rose increased
before dropping back to prior to decreasing
just above the original figure a little over the first number
to end the period at the end of the time surveyed
largest rise occurred in biggest increase was in
age range age bracket
quadrupled 4x, 400%
paralleled mirrored
growth increase
nearly doubling almost 2x, 200%
lastly finally
little change not much different
despite marginal growth regardless of a little rise
Pronunciation
Practice saying the words below using this tip with Google voice dictation:
ˈdiːteɪlz
fɜːst ʧaɪld
ˈlʊkɪŋ frɒm ən ˈəʊvərɔːl pəˈspɛktɪv, ɪt ɪz ˈrɛdɪli əˈpærənt ðæt
ɪn ðə pɑːst
ˈtɛndɪd tuː
ˈɜːlɪər ɪn laɪf
ɪsˈpɛʃəli
ˈkɒmən
rɪˈmeɪnd ˈrɛlətɪvli reə
ˈʌndə
ˈfɪgə drɒpt prɪˈsɪpɪtəsli
riːʧ
ˈdeɪtə
ˌʌndəˈwɛnt ə ˈsɪmɪlə drɒp
ˈfɔːlɪŋ frɒm … tuː
ˈfaɪnəli
ɪn ˈkɒntrɑːst
fɜːst geɪv bɜːθ
rəʊz
bɪˈfɔː ˈdrɒpɪŋ bæk tuː
ʤʌst əˈbʌv ði əˈrɪʤənl ˈfɪgə
tuː ɛnd ðə ˈpɪərɪəd
ˈlɑːʤɪst raɪz əˈkɜːd ɪn
eɪʤ reɪnʤ
ˈkwɒdrʊpld
ˈpærəlɛld
grəʊθ
ˈnɪəli ˈdʌblɪŋ
ˈlɑːstli
ˈlɪtl ʧeɪnʤ
dɪsˈpaɪt ˈmɑːʤɪnəl grəʊθ
Vocabulary Practice
The bar chart d_____s when women in Australia had their f_________d from 1966 to 2006. L________________________________________t women i_________________o have their first child e_________e, e________y very young women. Having a child in one’s 30s became much more c_________n, though after one’s 30s it r__________________e.
In 1966, 33% of women had their first child u______r the age of 19. This f________________________y to r_____h 11% by 2006. The d__a for women 19-24 u________________________p, f___________m 62% t__ 50% and f______y 28%.
I___________t, 36% of women were 19-24 years old when they f____________h in 1966 and this number then r____e to 50% in 1986 b_________________________o j_______________________e t__________________d. The l_____________________n the 30-34 a_________e which more than q____________d (11% to 18% to 45%). This p___________d the g________h for ages 34-39, n____________________g every 20 years from 9% to 17% and l______y 30%. Finally, there was l______________e for women over 40 d___________________h from 3% to 5%.
Listening Practice
Reading Practice
https://www.nytimes.com/interactive/2018/08/04/upshot/up-birth-age-gap.html
Speaking Practice
Practice with the following related questions from the real IELTS speaking exam:
Family
- Are you close with your family?
- Who do you talk to in your family the most?
- Do you have a large family?
- Are families becoming more distant in your country?
Writing Practice
Practice with the related chart below and then check with my sample answer:


Very useful..! Thanks a lot.
You’re welcome, Moditha!
Regarding
HI Dave,
The bar chart that describes ‘the details of women had their first child’ in your model answer has a wrong data in the first and second body respectively. Women under 19 stood at 62% instead of 33 as shown in the model answer. In para 3,instead of the age group 25-30 ,you have written 19-24.