This is an IELTS writing task 1 sample answer essay on the topic of birth rates in China and the USA from the real IELTS exam.
Find my full IELTS Ebooks here.
You can also find more line charts here.
Dave
IELTS Task 1: Birth Rates China and the USA
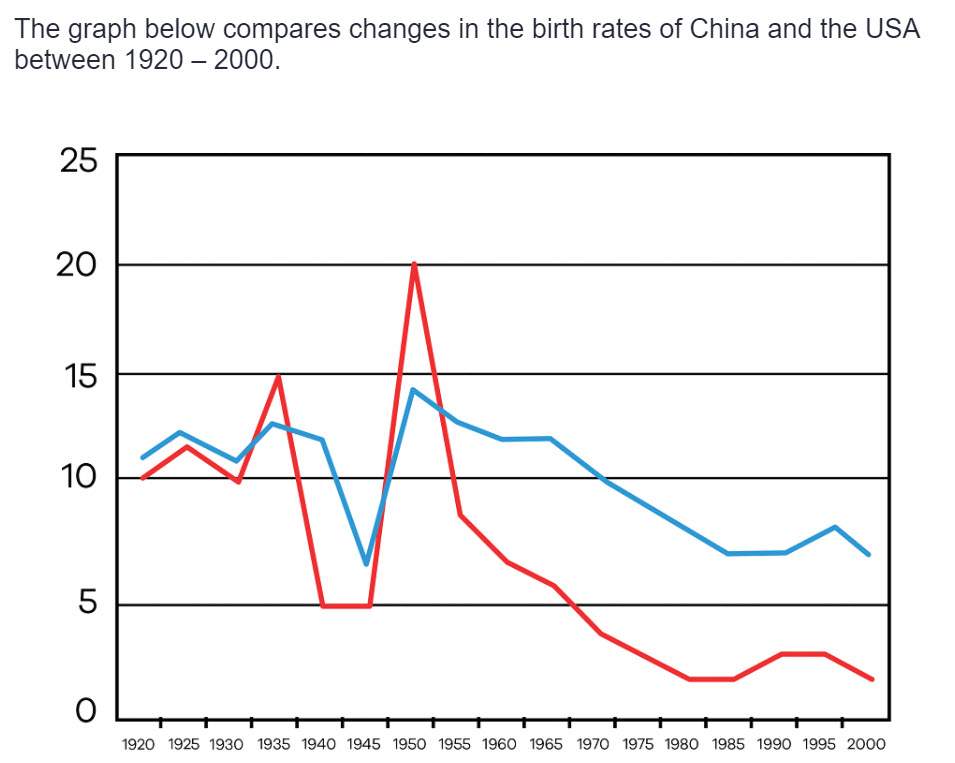
The line chart details birth rates for the United States and China from 1920 to 2000. Looking from an overall perspective, it is readily apparent that while birth rates in both nations followed similar trajectories and fell over the period, China’s decline was the most dramatic. The birth rate in the USA was higher for the majority of the period, with two brief exceptions in the first half of the century.
In 1920, the birth rate in the US stood at around 11%, 1% higher than that of China. The pattern for both nations was similar and erratic until around 1930 when there was a surge in China’s birth rate to 15% and a smaller rise in the US to 12%. Birth rates then dropped for the next 15 years, with China reaching a notable low of 5% and the USA dipping to 6%.
The birth rate in China quadrupled over the next few years to a high of 20%, which preceded a steady downturn with minor fluctuations and a data point at around 2% to end the period surveyed. Similarly, birth rates in the US rose, less significantly to approximately 14%, and thereafter experienced a more gradual slump to finish at 7% in 2000.
Analysis
1. The line chart details birth rates for the United States and China from 1920 to 2000. 2. Looking from an overall perspective, it is readily apparent that while birth rates in both nations followed similar trajectories and fell over the period, China’s decline was the most dramatic. 3. The birth rate in the USA was higher for the majority of the period, with two brief exceptions in the first half of the century.
- Paraphrase what the table shows.
- Write a clear overview summarising the differences.
- You might need another sentence for your overview.
1. In 1920, the birth rate in the US stood at around 11%, 1% higher than that of China. 2. The pattern for both nations was similar and erratic until around 1930 when there was a surge in China’s birth rate to 15% and a smaller rise in the US to 12%. 3. Birth rates then dropped for the next 15 years, with China reaching a notable low of 5% and the USA dipping to 6%.
- Begin writing about the data for the first categories.
- Make sure you compare as much as possible.
- Some task 1s essays will be a bit longer than others.
1. The birth rate in China quadrupled over the next few years to a high of 20%, which preceded a steady downturn with minor fluctuations and a data point at around 2% to end the period surveyed. 2. Similarly, birth rates in the US rose, less significantly to approximately 14%, and thereafter experienced a more gradual slump to finish at 7% in 2000.
- Write about the final, other parts of the graph – include everything!
- Compare the categories.
Vocabulary
What do the words in bold below mean? Take some notes on a piece of paper to aid your memory:
The line chart details birth rates for the United States and China from 1920 to 2000. Looking from an overall perspective, it is readily apparent that while birth rates in both nations followed similar trajectories and fell over the period, China’s decline was the most dramatic. The birth rate in the USA was higher for the majority of the period, with two brief exceptions in the first half of the century.
In 1920, the birth rate in the US stood at around 11%, 1% higher than that of China. The pattern for both nations was similar and erratic until around 1930 when there was a surge in China’s birth rate to 15% and a smaller rise in the US to 12%. Birth rates then dropped for the next 15 years, with China reaching a notable low of 5% and the USA dipping to 6%.
The birth rate in China quadrupled over the next few years to a high of 20%, which preceded a steady downturn with minor fluctuations and a data point at around 2% to end the period surveyed. Similarly, birth rates in the US rose, less significantly to approximately 14%, and thereafter experienced a more gradual slump to finish at 7% in 2000.
Answers
Try to write down or think of an antonym/opposite word for further practice:
details birth rates shows how many people are being born
Looking from an overall perspective, it is readily apparent that while overall
similar trajectories almost the same patterns
fell over the period went down over that time
decline drop
most dramatic strongest
the majority of the period for most of the time
brief exceptions times when this was not true
first half of the century first 50 years of 1900
stood at around was close to
pattern trajectory
similar almost the same
erratic uneven
until up to
around close to
surge big rise
smaller rise small increase
dropped fell
reaching a notable low of get to a low point of
dipping falling to
quadrupled 400%, 4x
a high of the largest point at
preceded before
steady downturn consistently going down
minor fluctuations small erratic rises and falls
data point statistic
end the period surveyed finish the time detailed
similarly in a similar way, the same
less significantly to approximately not as much to about
thereafter after that
experienced underwent
gradual slump minor drop
finish end at
Pronunciation
Practice saying the words below using this tip with Google voice dictation:
ˈdiːteɪlz bɜːθ reɪts
ˈlʊkɪŋ frɒm ən ˈəʊvərɔːl pəˈspɛktɪv, ɪt ɪz ˈrɛdɪli əˈpærənt ðæt waɪl
ˈsɪmɪlə ˈtræʤɪktəriz
fɛl ˈəʊvə ðə ˈpɪərɪəd
dɪˈklaɪn
məʊst drəˈmætɪk
ðə məˈʤɒrɪti ɒv ðə ˈpɪərɪəd
briːf ɪkˈsɛpʃənz
fɜːst hɑːf ɒv ðə ˈsɛnʧʊri
stʊd æt əˈraʊnd
ˈpætən
ˈsɪmɪlə
ɪˈrætɪk
ənˈtɪl
əˈraʊnd
sɜːʤ
ˈsmɔːlə raɪz
drɒpt
ˈriːʧɪŋ ə ˈnəʊtəbl ləʊ ɒv
ˈdɪpɪŋ
ˈkwɒdrʊpld
ə haɪ ɒv
pri(ː)ˈsiːdɪd
ˈstɛdi ˈdaʊntɜːn
ˈmaɪnə ˌflʌktjʊˈeɪʃənz
ˈdeɪtə pɔɪnt
ɛnd ðə ˈpɪərɪəd sɜːˈveɪd
ˈsɪmɪləli
lɛs sɪgˈnɪfɪkəntli tuː əˈprɒksɪmɪtli
ðeərˈɑːftə
ɪksˈpɪərɪənst
ˈgrædjʊəl slʌmp
ˈfɪnɪʃ
Vocabulary Practice
The line chart d________s b________s for the United States and China from 1920 to 2000. L___________________________________________e birth rates in both nations followed s_________________s and f____________________d, China’s d________e was the m____________c. The birth rate in the USA was higher for t___________________________d, with two b_______________s in the f_____________________y.
In 1920, the birth rate in the US s_______________d 11%, 1% higher than that of China. The p__________n for both nations was s_______r and e_________c u_______l a_______d 1930 when there was a s_____e in China’s birth rate to 15% and a s__________e in the US to 12%. Birth rates then d_________d for the next 15 years, with China r__________________________f 5% and the USA d________g to 6%.
The birth rate in China q____________d over the next few years to a______f 20%, which p_________d a s________________n with m________________s and a d___________t at around 2% to e______________________d. S___________y, birth rates in the US rose, l__________________________o a___________________y 14%, and t____________r e_______________d a more g______________p to f_______h at 7% in 2000.
Listening Practice
Reading Practice
https://www.nature.com/articles/d41586-022-00926-6
Speaking Practice
Practice with the following related questions from the real IELTS speaking exam:
Family
- Are you close with your family?
- Who do you talk to in your family the most?
- Do you have a large family?
- Are families becoming more distant in your country?
Writing Practice
Practice with the related chart below and then check with my sample answer:


Very useful. Excellent. Thank you
The line graph illustrates the rates of new born children in China and the USA over the span of 80 years.
It is clear from the given graph that both figures witnessed some fluctuations and plateau throughout the period.overall, the rates of both countries witnessed downward trajectory.
Regarding rates of the USA new born it began at approximately 13%. It was followed by a marginal increase in the next 15 years. Subsequently, the figure started to decline sharply and in 1945 it hit the rock bottom. Surprisingly, the rate once again rose and reached a peak of nearly 15% in 1950, it was the highest that the figure reached during the span. From that year onward, the percentages of new born children declined steadily and fell to over 5% at the end of the period.
Likewise, the percentage of chinese new born children was not that lower that the USA percentages. Despite some growth in the early years of the period, the figure plunged to 5% in 1940, and plateaued at 5% for 5 years, before starting to soar and summit 20% in 1950. The rate didn’t remain unchanged, the new birth rate declined considerably to just under 10%. Followed by a steady decrease in the next 50 years. The rate of The USA and china were 6 and 3 percentages at the end of the span, respectively.
Nice work Ross! Careful that some of your sentences are not full clauses!
Where it is mentioned that red line is China and blue is USA?