This is an IELTS writing task 1 sample answer essay on the topic of consumption and milk and butter (or dairy) from the real IELTS exam.
You can read the complete guide for Cambridge 16 here along with sample answers and essays.
Please consider supporting my efforts to creative high quality IELTS materials for students around the world by signing up for my Patreon (and so you won’t miss out on any of my exclusive IELTS Ebooks)!
Dave
IELTS Essay Task 1: Consumption of Milk and Butter
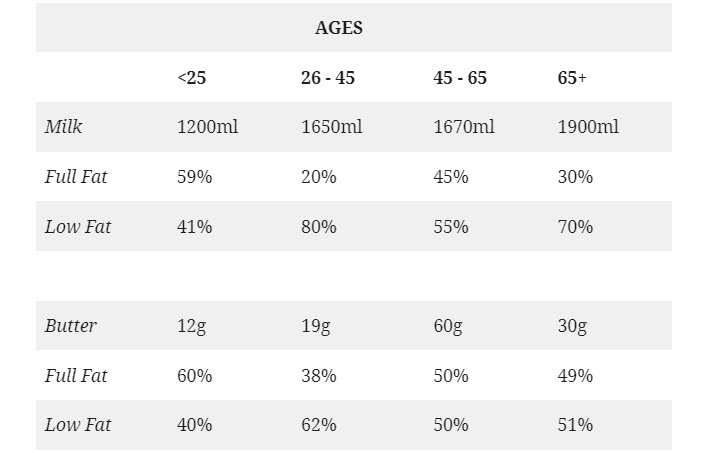
The table below illustrates weekly consumption by age group of dairy products in a European country.
Summarise the information by selecting and reporting the main features, and make comparisons where relevant.
| AGES | ||||
| <25 | 26 – 45 | 45 – 65 | 65+ | |
| Milk | 1200ml | 1650ml | 1670ml | 1900ml |
| Full Fat | 59% | 20% | 45% | 30% |
| Low Fat | 41% | 80% | 55% | 70% |
| Butter | 12g | 19g | 60g | 30g |
| Full Fat | 60% | 38% | 50% | 49% |
| Low Fat | 40% | 62% | 50% | 51% |
The table compares milk and butter purchases by age according to how much fat they contain. Looking from an overall perspective, it is readily apparent that younger people tend to consume less milk and butter, especially those under 25, though the fat content is highest for that group. The oldest group drink the most milk, mainly low fat, while those 45-65 eat the most butter.
Milk consumption for the under 25 group is lowest at 1,200ml, of which 59% is full fat and 41% low fat. This pattern is generally reversed for older people with individuals 26-45, 25-65, and 65+ drinking 1,650ml, 1,670ml, and 1,900ml, respectively. The fat content also is lower at 20% for 26-45, 45% for 45-65, and 30% for the oldest age bracket (and reciprocal figures for low fat consumption).
In terms of butter, younger people also use the least at just 12g, in contrast to 19g for those 26-45, and 60g and 30g for the two older groups in turn. Younger individuals similarly opt for more fat (60% full fat to 40% low fat), while the older demographics have much lower proportions here (38% full fat for 26-45, and around 50% for everyone over 45).
Analysis
1. The table compares milk and butter purchases by age according to how much fat they contain. 2. Looking from an overall perspective, it is readily apparent that younger people tend to consume less milk and butter, especially those under 25, though the fat content is highest for that group. 3. The oldest group drink the most milk, mainly low fat, while those 45-65 eat the most butter.
- Paraphrase what the table shows.
- Write a clear overview summarising the differences.
- You might need a second sentence for your overview.
1. Milk consumption for the under 25 group is lowest at 1,200ml, of which 59% is full fat and 41% low fat. 2. This pattern is generally reversed for older people with individuals 26-45, 25-65, and 65+ drinking 1,650ml, 1,670ml, and 1,900ml, respectively. 3. The fat content also is lower at 20% for 26-45, 45% for 45-65, and 30% for the oldest age bracket (and reciprocal figures for low fat consumption).
- Begin writing about the data for the first category.
- Describe the next area and compare it to the area before.
1. In terms of butter, younger people also use the least at just 12g, in contrast to 19g for those 26-45, and 60g and 30g for the two older groups in turn. 2. Younger individuals similarly opt for more fat (60% full fat to 40% low fat), while the older demographics have much lower proportions here (38% full fat for 26-45, and around 50% for everyone over 45).
- Write about the final other parts of the table – include everything!
- There is a lot of data in this one but try to get to all of it.
- Make sure nothing is missed.
Vocabulary
What do the words in bold below mean? Take some notes on a piece of paper to aid your memory:
The table compares milk and butter purchases by age according to how much fat they contain. Looking from an overall perspective, it is readily apparent that younger people tend to consume less milk and butter, especially those under 25, though the fat content is highest for that group. The oldest group drink the most milk, mainly low fat, while those 45-65 eat the most butter.
Milk consumption for the under 25 group is lowest at 1,200ml, of which 59% is full fat and 41% low fat. This pattern is generally reversed for older people with individuals 26-45, 25-65, and 65+ drinking 1,650ml, 1,670ml, and 1,900ml, respectively. The fat content also is lower at 20% for 26-45, 45% for 45-65, and 30% for the oldest age bracket (and reciprocal figures for low fat consumption).
In terms of butter, younger people also use the least at just 12g, in contrast to 19g for those 26-45, and 60g and 30g for the two older groups in turn. Younger individuals similarly opt for more fat (60% full fat to 40% low fat), while the older demographics have much lower proportions here (38% full fat for 26-45, and around 50% for everyone over 45).
Answers
Try to write down or think of an antonym/opposite word for further practice:
compares shows the differences between
purchases bought
according to related to
fat cluster of fatty acids found in cheese, butter, oil, etc.
contain have inside them
Looking from an overall perspective, it is readily apparent that overall
tend to usually
consume eat/drink
especially in particular
fat content amount of fat in something
highest biggest
mainly mostly
low fat not much fat content
consumption how much is eaten/used
lowest opposite of highest
pattern trend
generally reversed show the opposite mostly
respectively in turn
age bracket age group
reciprocal figures complementary statistics
in terms of when it comes to
in contrast to compared to
in turn respectively
similarly opt for in the same way choose
while however/in contrast
demographics groups of people
proportions ratios, percentages
around close to
over about
Pronunciation
Practice saying the words below using this tip with Google voice dictation:
kəmˈpeəz
ˈpɜːʧəsɪz
əˈkɔːdɪŋ tuː
fæt
kənˈteɪn
ˈlʊkɪŋ frɒm ən ˈəʊvərɔːl pəˈspɛktɪv, ɪt ɪz ˈrɛdɪli əˈpærənt ðæt
tɛnd tuː
kənˈsjuːm
ɪsˈpɛʃəli
fæt ˈkɒntɛnt
ˈhaɪɪst
ˈmeɪnli
ləʊ fæt
kənˈsʌm(p)ʃən
ˈləʊɪst
ˈpætən
ˈʤɛnərəli rɪˈvɜːst
rɪsˈpɛktɪvli
eɪʤ ˈbrækɪt
rɪˈsɪprəkəl ˈfɪgəz
ɪn tɜːmz ɒv
ɪn ˈkɒntrɑːst tuː
ɪn tɜːn
ˈsɪmɪləli ɒpt fɔː
waɪl
ˌdɛməˈgræfɪks
prəˈpɔːʃənz
əˈraʊnd
ˈəʊvə
Vocabulary Practice
Remember and fill in the blanks. Note it on a piece of paper so you can remember better:
The table c___________s milk and butter p_________s by age a____________o how much f___t they c__________n. L___________________________________________t younger people t___________o c___________e less milk and butter, e___________y those under 25, though the f____________t is h___________t for that group. The oldest group drink the most milk, m____________y l_________t, while those 45-65 eat the most butter.
Milk c__________________n for the under 25 group is l__________t at 1,200ml, of which 59% is full fat and 41% low fat. This p__________n is g________________________d for older people with individuals 26-45, 25-65, and 65+ drinking 1,650ml, 1,670ml, and 1,900ml, r_______________y. The fat content also is lower at 20% for 26-45, 45% for 45-65, and 30% for the oldest a_____________t (and r____________________s for low fat consumption).
I_____________f butter, younger people also use the least at just 12g, i______________o 19g for those 26-45, and 60g and 30g for the two older groups i_______n. Younger individuals s_____________y o_________r more fat (60% full fat to 40% low fat), w_______e the older d_______________s have much lower p_______________s here (38% full fat for 26-45, and a__________d 50% for everyone o_____r 45).
Listening Practice
Listen to the related topic below and practice with these activities:
Reading Practice
Read more and use these ideas to practice:
https://www.healthline.com/nutrition/is-dairy-bad-or-good
Speaking Practice
Practice with the following related questions from the real IELTS speaking exam:
Water
- Do you drink a lot of water?
- Do you prefer bottled or tap water?
- Did you drink a lot of water when you were younger?
- Would you say that bottled water is expensive in your country?
Writing Practice
Practice with the related table below and then check with my sample answer:


0 Comments