IELTS Essay Task 1: India’s GDP
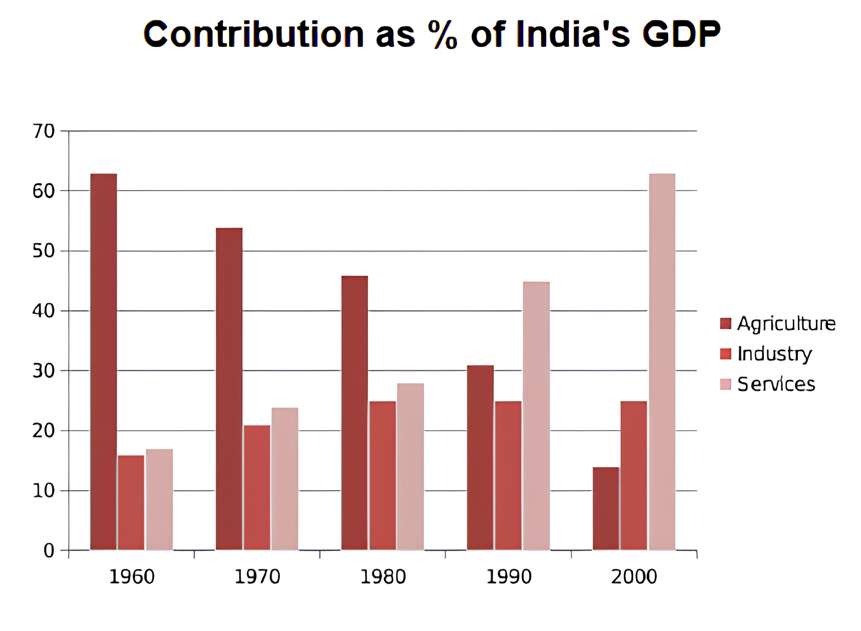
The bar chart details the constituent elements of India’s GDP divided into the agriculture, industry, and service sectors from 1960 to 2000. Looking from an overall perspective, it is readily apparent that services became by far the dominant field over the time surveyed, overtaking agriculture, which declined considerably. Industry increased but displayed a far less extreme trend, ending the period above agriculture.
In 1960, agriculture represented the overwhelming majority of India’s total GDP at near 63%, noticeably higher than industry and services at around 18% each. Over the next two decades, agriculture declined by 10% each year to fall to 45% in 1980 while there were reciprocal rises for industry and services, with both reaching just under 30% by the same year.
From 1980, agriculture continued a consistent decline that terminated at 25% in 2000. The trends for the remaining sectors then diverged with industry plateauing and remaining relatively stable around 23%. In contrast, the contribution of services to overall GDP more than doubled with near 20% surges over the ensuing decades to finish at 63%, a figure identical to the data point for agriculture 40 years prior.
Analysis
1. The bar chart details the constituent elements of India’s GDP divided into the agriculture, industry, and service sectors from 1960 to 2000. 2. Looking from an overall perspective, it is readily apparent that services became by far the dominant field over the time surveyed, overtaking agriculture, which declined considerably. 3. Industry increased but displayed a far less extreme trend, ending the period above agriculture.
1. In 1960, agriculture represented the overwhelming majority of India’s total GDP at near 63%, noticeably higher than industry and services at around 18% each. 2. Over the next two decades, agriculture declined by 10% each year to fall to 45% in 1980 while there were reciprocal rises for industry and services, with both reaching just under 30% by the same year.
1. From 1980, agriculture continued a consistent decline that terminated at 25% in 2000. 2. The trends for the remaining sectors then diverged with industry plateauing and remaining relatively stable around 23%. 3. In contrast, the contribution of services to overall GDP more than doubled with near 20% surges over the ensuing decades to finish at 63%, a figure identical to the data point for agriculture 40 years prior.
- Write about the final other parts of the graph – include everything!
- The paragraphs should be about equal length.
- Include all the data.
Vocabulary
What do the words in bold below mean? Make some notes on paper to aid memory and then check below.
The bar chart details the constituent elements of India’s GDP divided into the agriculture, industry, and service sectors from 1960 to 2000. Looking from an overall perspective, it is readily apparent that services became by far the dominant field over the time surveyed, overtaking agriculture, which declined considerably. Industry increased but displayed a far less extreme trend, ending the period above agriculture.
In 1960, agriculture represented the overwhelming majority of India’s total GDP at near 63%, noticeably higher than industry and services at around 18% each. Over the next two decades, agriculture declined by 10% each year to fall to 45% in 1980 while there were reciprocal rises for industry and services, with both reaching just under 30% by the same year.
From 1980, agriculture continued a consistent decline that terminated at 25% in 2000. The trends for the remaining sectors then diverged with industry plateauing and remaining relatively stable around 23%. In contrast, the contribution of services to overall GDP more than doubled with near 20% surges over the ensuing decades to finish at 63%, a figure identical to the data point for agriculture 40 years prior.
Answers
For extra practice, write an antonym (opposite word) on a piece of paper to help you remember the new vocabulary:
- Details the constituent elements of → Outlines the key components of
- Divided into → Categorized into
- Agriculture → Farming and cultivation
- Industry → Manufacturing and production
- Service → Tertiary sector
- Looking from an overall perspective, it is readily apparent that → From a broad viewpoint, it is clear that
- Became by far the dominant field → Emerged as the leading sector
- Over the time surveyed → Throughout the analyzed period
- Overtaking → Surpassing
- Declined considerably → Dropped significantly
- Displayed a far less extreme trend → Exhibited a more moderate pattern
- Ending the period above → Concluding the timeframe higher than
- Represented the overwhelming majority of → Accounted for the vast bulk of
- Noticeably higher than → Substantially greater than
- Each → Every individual
- Over the next two decades → Across the following 20 years
- Fall to → Decrease to
- There were reciprocal rises for → Corresponding increases occurred for
- Reaching just under → Approaching slightly below
- By the same year → In the corresponding year
- Continued a consistent decline that terminated at → Maintained a steady decrease, ending at
- The trends for the remaining sectors then diverged → The patterns for the other categories then shifted in different directions
- Plateauing → Stabilizing
- Remaining relatively stable → Staying mostly unchanged
- Contribution to → Share in
- Overall GDP → Total economic output
- More than doubled with → Grew by over twice, accompanied by
- Surges → Significant increases
- Over the ensuing decades to finish at → Across the following years, concluding at
- A figure identical to the data point for → A value matching the recorded point for
- Prior → Earlier or preceding
Pronunciation
Practice saying the vocabulary below and use this tip about Google voice search:
ˈdiːteɪlz ðə kənˈstɪʧuənt ˈɛlɪmənts ɒv
dɪˈvaɪdɪd ˈɪntuː
ˈæɡrɪkʌlʧə
ˈɪndəstri
ˈsɜːvɪs
ˈsɛktəz
ˈlʊkɪŋ frɒm ən ˌəʊvəˈrɔːl pəˈspɛktɪv, ɪt ɪz ˈrɛdɪli əˈpærᵊnt ðæt
bɪˈkeɪm baɪ fɑː ðə ˈdɒmɪnənt fiːld
ˈəʊvə ðə taɪm ˈsɜːveɪd
ˌəʊvəˈteɪkɪŋ
dɪˈklaɪnd kənˈsɪdᵊrəbᵊli
dɪˈspleɪd ə fɑː lɛs ɪkˈstriːm trɛnd
ˈɛndɪŋ ðə ˈpɪəriəd əˈbʌv
ˌrɛprɪˈzɛntɪd ði ˌəʊvəˈwɛlmɪŋ məˈʤɒrəti ɒv
ˈnəʊtɪsəbli ˈhaɪə ðæn
iːʧ
ˈəʊvə ðə nɛkst tuː ˈdɛkeɪdz
fɔːl tuː
ðeə wɜː rɪˈsɪprəkᵊl ˈraɪzɪz fɔː
ˈriːʧɪŋ ʤʌst ˈʌndə
baɪ ðə seɪm jɪə
kənˈtɪnjuːd ə kənˈsɪstᵊnt dɪˈklaɪn ðæt ˈtɜːmɪneɪtɪd æt
ðə trɛndz fɔː ðə rɪˈmeɪnɪŋ ˈsɛktəz ðɛn daɪˈvɜːʤd
ˈplætəʊɪŋ
rɪˈmeɪnɪŋ ˈrɛlətɪvli ˈsteɪbᵊl
ˌkɒntrɪˈbjuːʃᵊn əʊ
ˌəʊvəˈrɔːl ʤiː-diː-piː
mɔː ðæn ˈdʌbᵊld wɪð
ˈsɜːʤɪz
ˈəʊvə ði ɪnˈsjuːɪŋ ˈdɛkeɪdz tuː ˈfɪnɪʃ æt
ə ˈfɪɡər aɪˈdɛntɪkᵊl tuː ðə ˈdeɪtə pɔɪnt fɔː
ˈpraɪə
Vocabulary Practice
I recommend getting a pencil and piece of paper because that aids memory. Then write down the missing vocabulary from my sample answer in your notebook:
The bar chart d____________________________f India’s GDP d_________o the a_______e, i_______y, and s____________s from 1960 to 2000. L______________________________________________t services b__________________________________________________d, o_________g agriculture, which d______________________y. Industry increased but d_________________________d, e___________________e agriculture.
In 1960, agriculture r_________________________________f India’s total GDP at near 63%, n______________________n industry and services at around 18% e____h. O___________________s, agriculture declined by 10% each year to f_____o 45% in 1980 while t___________________________________r industry and services, with both r_______________r 30% b________________r.
From 1980, agriculture c___________________________________________t 25% in 2000. T_____________________________________________d with industry p___________g and r______________________e around 23%. In contrast, the c___________n of services to o______________________________________h near 20% s_______________________________________t 63%, a_______________________________________________r agriculture 40 years p______r.
Listening Practice
Learn more about this topic by watching from YouTube below and practice with these activities:
Reading Practice
Read more about this topic and use these ideas to practice:
Speaking Practice
Work-life balance (IELTS Speaking Part 3)
Question 1: What kinds of jobs do young people not want to do in your country?
Question 2: Who is best at advising young people about choosing a job: teachers or parents?
Question 3: Is money always the most important thing when choosing a job?
Question 4: Do you agree that most people nowadays are under pressure to work longer hours and take less holiday?
Question 5: What is the impact on society of people having a poor work-life balance?
Question 6: Could you recommend some effective strategies for governments and employers to ensure people have a good work-life balance?
Writing Practice
Many governments think that economic progress is their most important goal. Some people, however, think that other types of progress are equally important for a country.
Discuss both these views and give your own opinion.


0 Comments