IELTS Essay Task 1: Transport Preferences Among Young People
The bar chart below shows transport preferences among young people in four countries in a single year.
Summarise the information by selecting and reporting the main features, and make comparisons where relevant.
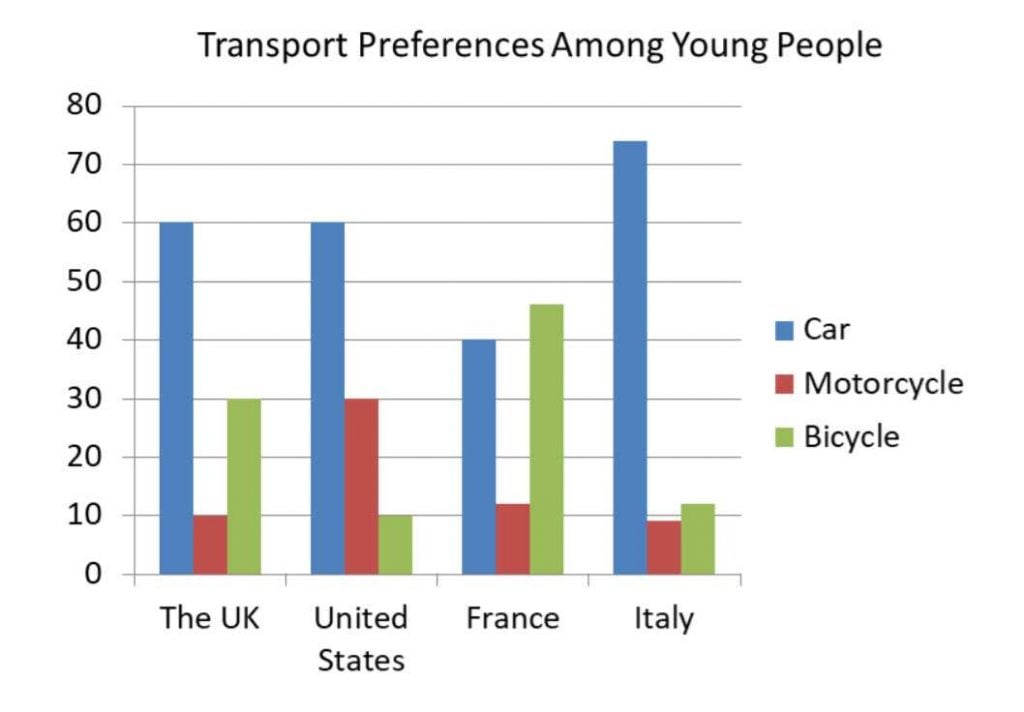
The bar chart details transport preferences for young people in terms of cars, motorcycles, and bicycles in the United Kingdom, the United States, France and Italy. Looking from an overall perspective, it is readily apparent that cars are more popular in the UK, the US and especially Italy while the French prefer to ride bicycles. In all countries except the United States, motorcycles are the least common option.
Considering the statistics for cars first of all, the United States and the United Kingdom have identical figures at 60% each. Italy is noticeably higher at 75% while just 40% of younger individuals in France drive cars. In most nations, bicycles are also pervasive, with the highest number in France at 47%, followed by 30% in the UK, slightly over 10% in Italy, and precisely 10% in the US.
Motorcycles are only a significant choice for younger people in the United States (30% ride motorcycles there), and in contrast the figures for France, the UK, and Italy merely reach 11%, 10%, and 9%, respectively.
Analysis
1. The bar chart details transport preferences for young people in terms of cars, motorcycles, and bicycles in the United Kingdom, the United States, France and Italy. 2. Looking from an overall perspective, it is readily apparent that cars are more popular in the UK, the US and especially Italy while the French prefer to ride bicycles. 3. In all countries except the United States, motorcycles are the least common option.
- Paraphrase what the bar chart shows.
- Write a clear overview summarising the differences.
- You might need a second sentence for your overview.
1. Considering the statistics for cars first of all, the United States and the United Kingdom have identical figures at 60% each. 2. Italy is noticeably higher at 75% while just 40% of younger individuals in France drive cars. 3. In most nations, bicycles are also pervasive, with the highest number in France at 47%, followed by 30% in the UK, slightly over 10% in Italy, and precisely 10% in the US.
- Begin writing about the data for the first category.
- Make sure you compare as much as possible.
- Finish with the rest of the data.
1. Motorcycles are only a significant choice for younger people in the United States (30% ride motorcycles there), and in contrast the figures for France, the UK, and Italy merely reach 11%, 10%, and 9%, respectively.
- Write about the final other parts of the graph – include everything!
Vocabulary
What do the words in bold below mean? Take some notes on a piece of paper to aid your memory:
The bar chart details transport preferences for young people in terms of cars, motorcycles, and bicycles in the United Kingdom, the United States, France and Italy. Looking from an overall perspective, it is readily apparent that cars are more popular in the UK, the US and especially Italy while the French prefer to ride bicycles. In all countries except the United States, motorcycles are the least common option.
Considering the statistics for cars first of all, the United States and the United Kingdom have identical figures at 60% each. Italy is noticeably higher at 75% while just 40% of younger individuals in France drive cars. In most nations, bicycles are also pervasive, with the highest number in France at 47%, followed by 30% in the UK, slightly over 10% in Italy, and precisely 10% in the US.
Motorcycles are only a significant choice for younger people in the United States (30% ride motorcycles there), and in contrast the figures for France, the UK, and Italy merely reach 11%, 10%, and 9%, respectively.
Answers
Try to write down or think of an antonym/opposite word for further practice:
details shows
transport preferences what vehicles you like to use
Looking from an overall perspective, it is readily apparent that overall
especially in particular
except not including
least common option not used often
considering concerning
statistics figures, data
first of all firstly
identical figures the same numbers
each each one
noticeably higher much more
while in contrast
in most nations in most countries
pervasive common
followed by after
slightly over more than
precisely exactly
significant choice common
in contrast however
merely reach just get to
respectively in turn
Pronunciation
Practice saying the words below using this tip with Google voice dictation:
ˈdiːteɪlz
ˈtrænspɔːt ˈprɛfərənsɪz
ˈlʊkɪŋ frɒm ən ˈəʊvərɔːl pəˈspɛktɪv, ɪt ɪz ˈrɛdɪli əˈpærənt ðæt
ɪsˈpɛʃəli
ɪkˈsɛpt
liːst ˈkɒmən ˈɒpʃən
kənˈsɪdərɪŋ
stəˈtɪstɪks
fɜːst ɒv ɔːl
aɪˈdɛntɪkəl ˈfɪgəz
iːʧ
ˈnəʊtɪsəbli ˈhaɪə
waɪl
ɪn məʊst ˈneɪʃənz
pɜːˈveɪsɪv
ˈfɒləʊd baɪ
ˈslaɪtli ˈəʊvə
prɪˈsaɪsli
sɪgˈnɪfɪkənt ʧɔɪs
ɪn ˈkɒntrɑːst
ˈmɪəli riːʧ
rɪsˈpɛktɪvli
Vocabulary Practice
Remember and fill in the blanks. Note it on a piece of paper so you can remember better:
The bar chart d_________s t_________________________s for young people in terms of cars, motorcycles, and bicycles in the United Kingdom, the United States, France and Italy. L_________________________________________________________t cars are more popular in the UK, the US and e______________y Italy while the French prefer to ride bicycles. In all countries e_______t the United States, motorcycles are the l_________________________n.
C________________g the s__________s for cars f_____________l, the United States and the United Kingdom have i_________________s at 60% e______h. Italy is n_____________________r at 75% w______e just 40% of younger individuals in France drive cars. I_______________s, bicycles are also p_____________e, with the highest number in France at 47%, f________________y 30% in the UK, s______________r 10% in Italy, and p___________y 10% in the US.
Motorcycles are only a s________________e for younger people in the United States (30% ride motorcycles there), and i_________________t the figures for France, the UK, and Italy m_______________h 11%, 10%, and 9%, r___________y.
Listening Practice
Listen to the related topic below and practice with these activities:
Reading Practice
Read more and use these ideas to practice:
Speaking Practice
Practice with the following related questions from the real IELTS speaking exam:
Walking
- Do you go places on foot a lot?
- Did you walk more when you were younger?
- Why do some people prefer walking to driving a car?
- Do people in your country walk a lot?
Writing Practice
Practice with the related chart below and then check with my sample answer:


writing is nicely prepared thanku
You’re welcome!
Very well structured essay. Very helpful!
Thanks, Sandra!
The figure compares the preferences of vehicles among youth in the UK, the US, France and Italy.
It is clear that most youth like cars more than other modes of transport in the UK, US and Italy, while French youth prefer bicycles. And the last choice for youth in the UK, France and Italy is a motorcycle, but it is a bicycle in the US instead.
In these four countries, cars are loved by teenagers in a large amount. There are about 73 percent of young people who prefer cars in Italy and 60 percent in both the UK and the US. The percentage in France is a little bit lower, but there are also 40 percent of young people who like cars.
The preferences for motorcycles and bicycles are different in these four countries. Youth in the UK and France prefer bicycles much more than those like motorcycles. Specifically, the preferences of bicycles in France are even 5 percent higher than cars. And the percentage of young people in the US who like motorcycles is 20 percent higher than bicycles, which is on the contrary of the UK. The preferences between motorcycles and bicycles are almost the same in Italy.
The bar chart details travelling usage for three modes of transport of young people in 4 distinct countries
Can I use:
. Italy is noticeably higher, with three in four of younger individuals driving cars, but only 40% in France
It’s ok but sounds a bit strange – did you copy and paste it?
i actually just try to replace “75%” to “three in four” in your sentence but don’t know how.
Italy is noticeably higher at 75% while just 40% of younger individuals in France drive cars
‘at three in every 4 individuals driving cars while…’
That’s how you can change it!
The bar chart details the percentage of younger individuals travelling by three modes of transport in four different countries.
In general, cars are the most common option for all countries with the notable exception of France where the youth prefers to ride bicycles. While motorcycles are the least favoured in most countries, bicycles are in France.
The least used transport in each nation, which is the bicycle in the United States and the motorcycle in the other three countries, constituted similar figures at approximately 10%. However, driving with bikes in France and motorcycles in the US are popular ways of transport among younger people at 47% and 30%, respectively.
Cars remain the most popular as 60% of younger individuals in the UK and the US, and three in every five junior Italians opt for this. By contrast, the statistic for the car in France is slightly lower than that of bicycles, accounting for 40%.
Great work! Really good overview!
The bar chart illustrates the proportion of transport preferences among young generation from three transportations between four countries, The UK, The US and especially Italy.
Overall,it is clear that cars are more popular in the UK,in The USA and especially Italy,However, in terms of France prefer to ride bicycles.In all countries except the USA,motorcycles are less common option.
Looking at the graph, car’s rate in the UK and in The USA have identical figures at 60% each. Italy is noticiebly higher at 75%,while the figure for France’s individuals drive cars at 40%.
In most nations, bicycles are also common,with the highest number in France at 47%,followed by 30% in the UK,slightly over 10%in Italy,and same figures in the US at 10%. When it comes to motorcycles in the USA are significant choice 30%,while the figure for other 3 nations merely reach 11%,10% and 9% respectively.
I thought we were asked to ‘summarize’ the graphs content, yet you have nearly all the numbers from the graph, for example “the figures for France, the UK, and Italy merely reach 11%, 10%, and 9%, respectively”, wouldn’t it be better if they were grouped to ‘around 10% each” ? I’m just trying to understand when is it appropriate to group them and when should I list them individually.
Yes, that’s what they say but in fact it is better to include a lot of data – summarize too much and you might be penalized.
But try not to mention every single bit of data.