IELTS Task 1 Essay: Forest Industry Production
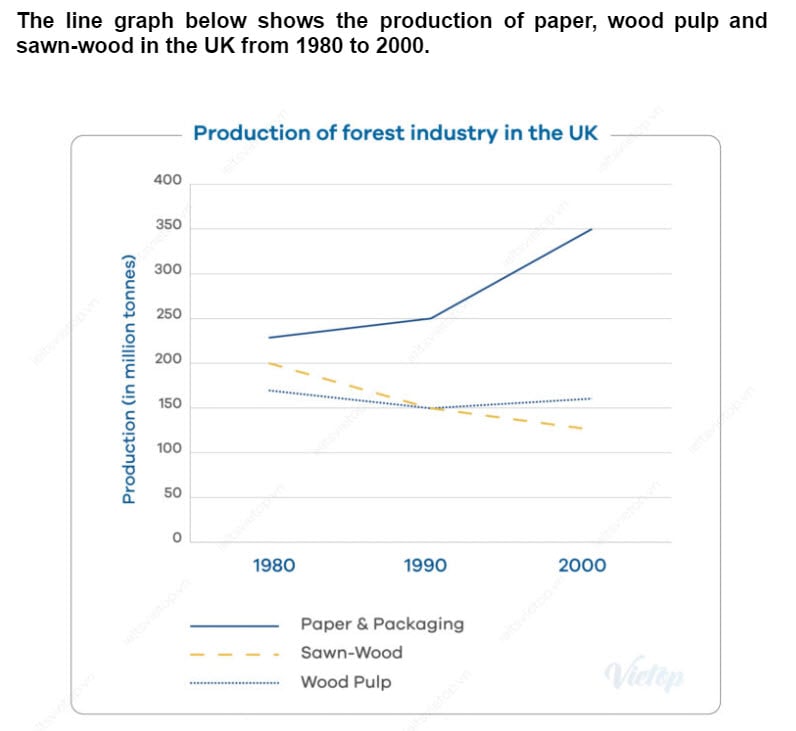
The line chart displays data concerning production from the forest industry in the UK from 1980 to 2000. Looking from an overall perspective, it is readily apparent that paper and packaging not only accounted for the most production throughout but also increased most significantly. Production of wood pulp fell slightly but overtook sawn-wood, which dropped steadily, by the end of the period.
Looking first of all at paper and packing, production in 1980 stood at approximately 230 million tonnes and grew steadily to 250 million by 1990. Over the next 10 years, output surged, finally reaching 350,000,000 tonnes by 2000.
Sawn-wood and wood pulp were considerably lower. The former started at precisely 200 million tonnes and fell consistently over the time surveyed to end at close to 140 million. In contrast, wood pulp began lower at 165 million tonnes, declined gradually to 150 million in 1990 and then recovered slightly to just over 155 million tonnes in 2000.
Analysis
1. The line chart displays data concerning production from the forest industry in the UK from 1980 to 2000. 2. Looking from an overall perspective, it is readily apparent that paper and packaging not only accounted for the most production throughout but also increased most significantly. 3. Production of wood pulp fell slightly but overtook sawn-wood, which dropped steadily, by the end of the period.
- Paraphrase what the table shows.
- Write a clear overview summarising the differences.
- You might need another sentence for your overview.
1. Looking first of all at paper and packing, production in 1980 stood at approximately 230 million tonnes and grew steadily to 250 million by 1990. 2. Over the next 10 years, output surged, finally reaching 350,000,000 tonnes by 2000.
- Begin writing about the data for the first categories.
- Make sure you compare as much as possible.
1. Sawn-wood and wood pulp were considerably lower. 2. The former started at precisely 200 million tonnes and fell consistently over the time surveyed to end at close to 140 million. 3. In contrast, wood pulp began lower at 165 million tonnes, declined gradually to 150 million in 1990 and then recovered slightly to just over 155 million tonnes in 2000.
- Write about the final other parts of the graph – include everything!
- Compare the categories.
- Everything must be included.
Vocabulary
What do the words in bold below mean? Take some notes on a piece of paper to aid your memory:
The line chart displays data concerning production from the forest industry in the UK from 1980 to 2000. Looking from an overall perspective, it is readily apparent that paper and packaging not only accounted for the most production throughout but also increased most significantly. Production of wood pulp fell slightly but overtook sawn-wood, which dropped steadily, by the end of the period.
Looking first of all at paper and packing, production in 1980 stood at approximately 230 million tonnes and grew steadily to 250 million by 1990. Over the next 10 years, output surged, finally reaching 350,000,000 tonnes by 2000.
Sawn-wood and wood pulp were considerably lower. The former started at precisely 200 million tonnes and fell consistently over the time surveyed to end at close to 140 million. In contrast, wood pulp began lower at 165 million tonnes, declined gradually to 150 million in 1990 and then recovered slightly to just over 155 million tonnes in 2000.
Answers
Try to write down or think of an antonym/opposite word for further practice:
displays shows
data numbers, figures
concerning having to do with
production how much is made
forest industry cutting down trees
UK the United Kingdom
Looking from an overall perspective, it is readily apparent that overall
paper and packaging pieces of paper, boxes, etc.
accounted for took up
most production made the most
throughout the whole time
increased most significantly went up the most
wood pulp a material for making various wood products
fell slightly went down a little
overtook sawn-wood rose above wood that has been sawed/cut
dropped steadily decreased consistently
by the end of the period at the end of the time surveyed
looking first of all at considering first
stood at approximately was at around
grew steadily increased consistently
over the next for the following
output surged production grew a lot
finally reaching in the end getting to
considerably lower much less
former mentioned first
started at began at
precisely exactly
fell consistently went down steadily
over the time surveyed the time recorded in the graph
to end at close to finish at around
in contrast however
began lower at started at less than that
declined gradually decreased a little
recovered slightly came back up a little
just over a little above
Pronunciation
Practice saying the words below using this tip with Google voice dictation:
dɪsˈpleɪz
ˈdeɪtə
kənˈsɜːnɪŋ
prəˈdʌkʃən
ˈfɒrɪst ˈɪndəstri
juː-keɪ
ˈlʊkɪŋ frɒm ən ˈəʊvərɔːl pəˈspɛktɪv, ɪt ɪz ˈrɛdɪli əˈpærənt ðæt
ˈpeɪpər ænd ˈpækɪʤɪŋ
əˈkaʊntɪd fɔː
məʊst prəˈdʌkʃən
θru(ː)ˈaʊt
ɪnˈkriːst məʊst sɪgˈnɪfɪkəntli
wʊd pʌlp
fɛl ˈslaɪtli
ˌəʊvəˈtʊk sɔːn-wʊd
drɒpt ˈstɛdɪli
baɪ ði ɛnd ɒv ðə ˈpɪərɪəd
ˈlʊkɪŋ fɜːst ɒv ɔːl æt
stʊd æt əˈprɒksɪmɪtli
gruː ˈstɛdɪli
ˈəʊvə ðə nɛkst
ˈaʊtpʊt sɜːʤd
ˈfaɪnəli ˈriːʧɪŋ
kənˈsɪdərəbli ˈləʊə
ˈfɔːmə
ˈstɑːtɪd æt
prɪˈsaɪsli
fɛl kənˈsɪstəntli
ˈəʊvə ðə taɪm sɜːˈveɪd
tuː ɛnd æt kləʊs tuː
ɪn ˈkɒntrɑːst
bɪˈgæn ˈləʊər æt
dɪˈklaɪnd ˈgrædjʊəli
rɪˈkʌvəd ˈslaɪtli
ʤʌst ˈəʊvə
Vocabulary Practice
The line chart d_______________a c_____________g p__________n from the f_____________y in the U__ from 1980 to 2000. L__________________________________________________t p__________________g not only a______________r the m______________________t but also i_________________________y. Production of w_________p f___________y but o___________k s_____________d, which d______________y, b_____________________d.
L_______________________t paper and packing, production in 1980 s______________________y 230 million tonnes and g_____________________y to 250 million by 1990. O_____________t 10 years, o______________d, f______________g 350,000,000 tonnes by 2000.
Sawn-wood and wood pulp were c__________r. The f_____________r s_____________t p___________y 200 million tonnes and f______________________y o____________________d t______________________o 140 million. I____________t, wood pulp b_____________t 165 million tonnes, d________________y to 150 million in 1990 and then r______________y to j_______r 155 million tonnes in 2000.
Listening Practice
Reading Practice
Speaking Practice
Practice with the following related questions from the real IELTS speaking exam:
Deforestation
- Does your country have a lot of forests?
- What threats are posed by deforestation?
- Are there alternatives to cutting down forests?
- What can the average citizen do to help combat this situation?
- What will the future of the Earth’s forests look like?
Writing Practice
Practice with the related chart below and then check with my sample answer:
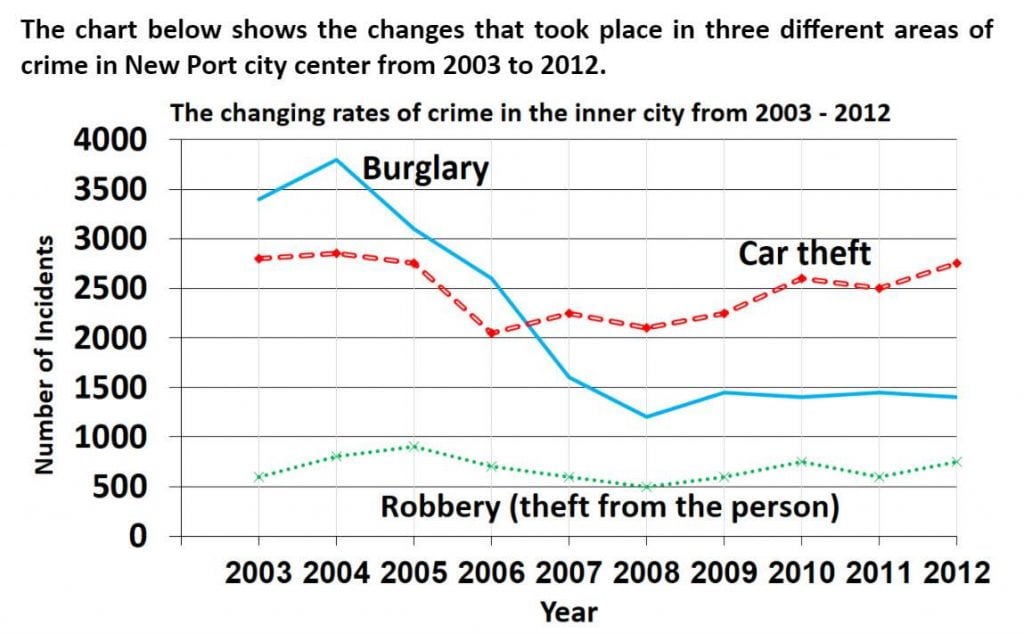


The graph above details information concerning the production of three wood products in UK in a 20 years period (from 1980 to 2000). Looking from an overall perspective, it is readily apparent that the paper and packaging products had an increasing pattern while wood pulp production remained the same and sawn-wood decreased.
In 1980, paper and packaging figure began the period at the highest point compared to other products (230 million tonnes) and before 1990 while the production of sawn-wood and wood pulp had been decreasing, the rate of making paper related products had been growing which by 1990 each had rates of 250, 150 and 150 respectively. After 1990, the rate of production of paper soared to an all time high of 350 million tonnes while wood pulp overtook the production of swan wood and rose to nearly 110 million tonnes by the year 2000. However, swan-wood production pattern maintained its decline and finished the period at 130million tonnes.
The given line graph illustrates the proportion of different kinds of forest products in the UK between 1989 to 2000.
Overall, paper and packaging reached a peak by the middle of the period, then hitting a high point. Sawn-wood showed a gradual decline over the whole period and the rising considerably of wood pulp toward the ended-year.
Regarding paper and packaging, in 1980 they started at 225 percent and leaped to 250 percent in 1990, after this point which reached the highest production to 350 million tonnes by 2000.
Turning to Wood Pulp and Sawn Wood, they experienced a downward trend in 1980 and took plummets in 1990. Wood Pulp showed a steady increase of just under 110 million tonnes to the end of the period.
By contrast, there was a fall in the production of Sawn-Wood, which continuously reduce to under 150 million tonnes until the end of the period.