This is an IELTS writing task 1 sample answer essay on the topic of the share of income earned by the top 1 percent from 1975 to 2015.
IELTS Task 1: Share of Income Earned by Top 1 Percent
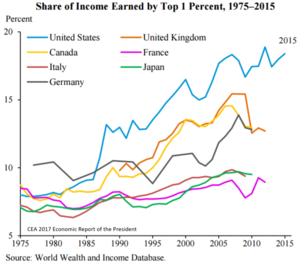
In terms of the countries with the greatest increases, the United States rose steadily from 8% in 1975 to 9% by 1986 before a precipitous climb to 13% over the next several years and a surge with occasional fluctuations over the remainder of the period to finish at around 18%. The rises for Germany, the UK, and Canada followed similar though slightly lower trajectories with only the former beginning high (11%) and all 3 nations finishing with comparable dips to near 13% in 2015.
For the nations with more marginal rises, there were similar declines to near 2% for France, Japan, and Italy for the first decade in question prior to steady rises in the 1980s. In 1990, France and Japan fell again to around 3%, though all 3 countries recovered and continued to increase consistently until the end of the period, with final figures just below 5%.
Analysis
1. In terms of the countries with the greatest increases, the United States rose steadily from 8% in 1975 to 9% by 1986 before a precipitous climb to 13% over the next several years and a surge with occasional fluctuations over the remainder of the period to finish at around 18%. 2. The rises for Germany, the UK, and Canada followed similar though slightly lower trajectories with only the former beginning high (11%) and all 3 nations finishing with comparable dips to near 13% in 2015.
1. For the nations with more marginal rises, there were similar declines to near 2% for France, Japan, and Italy for the first decade in question prior to steady rises in the 1980s. 2. In 1990, France and Japan fell again to around 3%, though all 3 countries recovered and continued to increase consistently until the end of the period, with final figures just below 5%.
Vocabulary
In terms of the countries with the greatest increases, the United States rose steadily from 8% in 1975 to 9% by 1986 before a precipitous climb to 13% over the next several years and a surge with occasional fluctuations over the remainder of the period to finish at around 18%. The rises for Germany, the UK, and Canada followed similar though slightly lower trajectories with only the former beginning high (11%) and all 3 nations finishing with comparable dips to near 13% in 2015.
For the nations with more marginal rises, there were similar declines to near 2% for France, Japan, and Italy for the first decade in question prior to steady rises in the 1980s. In 1990, France and Japan fell again to around 3%, though all 3 countries recovered and continued to increase consistently until the end of the period, with final figures just below 5%.
Answers
In terms of regarding
rose steadily increased consistently
before a precipitous climb to prior to a big rise to reach
surge with occasional fluctuations over the remainder of the period to finish at around increased a lot with an erratic trend for the rest of the time to end at
rises increases
followed similar though slightly lower trajectories went in the same direction but a little lower
the former the one mentioned first
finishing with comparable dips to near ending with similar falls to close to
marginal rises small increases
similar declines to near comparable falls to close to
the first decade in question prior to steady rises the first 10 years detailed before consistent increases
recovered came back up
continued to increase consistently until the end of the period kept going up steadily to the end
Pronunciation
Vocabulary Practice
I_____________f the countries with the greatest increases, the United States r_____________y from 8% in 1975 to 9% by 1986 b_______________________________o 13% over the next several years and a s__________________________________________________________________________________________d 18%. The r_____s for Germany, the UK, and Canada f_________________________________________________s with only t_____________r beginning high (11%) and all 3 nations f________________________________________r 13% in 2015.
For the nations with more m_______________s, there were s_______________________r 2% for France, Japan, and Italy for t______________________________________________s in the 1980s. In 1990, France and Japan fell again to around 3%, though all 3 countries r___________d and c____________________________________________________________________d, with final figures just below 5%.
Listening Practice
Reading Practice
Speaking Practice
Work (Model answer available on my Patreon)
- Are you student or are you working now?
- What do you like about your job/school at the moment?
- What job would you like to do in the future?


0 Comments