This is an IELTS writing task 1 sample answer essay on the topic of poverty and gender.
You can also get my full EBooks below:
Dave
IELTS Task 1: Number of Jobs
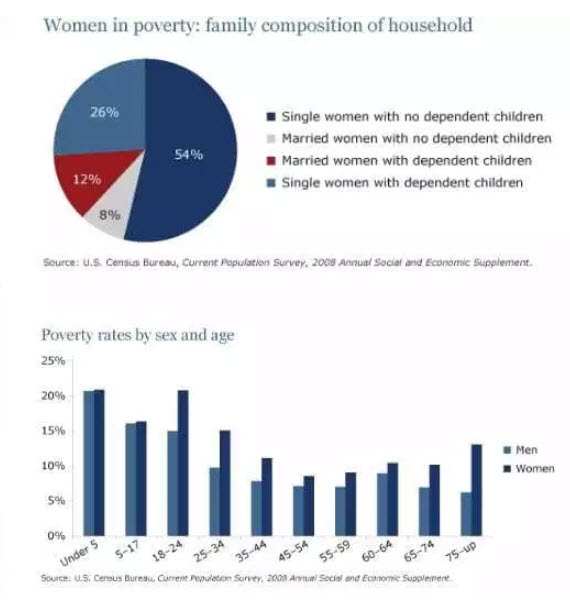
The pie chart shows women in poverty in the United States and bar chart compares poverty rates by gender.
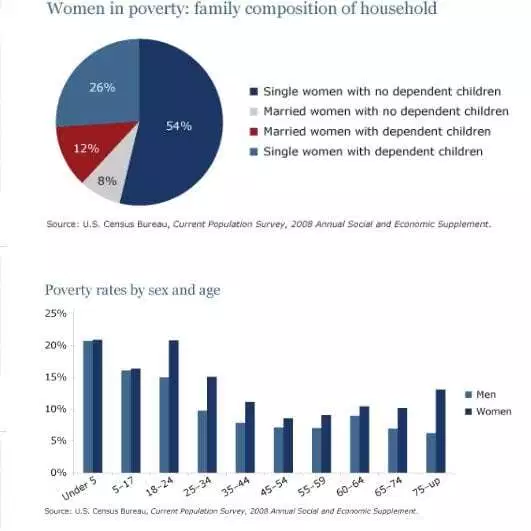
The pie chart gives statistics for the status of women in poverty and the bar chart breaks down poverty by gender and age demographics in 2008. Looking from an overall perspective, it is readily apparent that the majority of women in poverty are single without children, followed by single with children, and much more distantly by married women with or without offspring. In terms of gender and age, younger people and women were more likely to be in poverty, particularly female young adults and the elderly.
Looking first of all at the pie chart, an overwhelming 54% of women in poverty were unmarried without children. This figure was more than double that of single females with children (26%) and considerably above married women with dependents (12%) and married women lacking any children (8%).
In terms of the rate of poverty relating to gender and age, more than 20% of those under the age of 5 were in poverty for both sexes. Poverty rates then generally declined for men and women until the age of 45 – 54 to relative lows of 7% and 6%, respectively. The exception was that over 20% of women aged 18 – 24 are in poverty, equal to the peak of the youngest demographic. After the age of 54, poverty likelihood for men rose to 9% for those aged 60-64 and then dropped to 5% for those over 75. For women, poverty levels rose more steadily to reach 12% for the oldest age group.
Analysis
1. The pie chart gives statistics for the status of women in poverty and the bar chart breaks down poverty by gender and age demographics in 2008. 2. Looking from an overall perspective, it is readily apparent that the majority of women in poverty are single without children, followed by single with children, and much more distantly by married women with or without offspring. 3. In terms of gender and age, younger people and women were more likely to be in poverty, particularly female young adults and the elderly.
- Paraphrase what the bar chart shows.
- Write a clear overview summarising the differences and the overall trend.
- This one is a little complex so it needs a second sentence for the overview.
1. Looking first of all at the pie chart, an overwhelming 54% of women in poverty were unmarried without children. 2. This figure was more than double that of single females with children (26%) and considerably above married women with dependents (12%) and married women lacking any children (8%).
- Begin writing about the data for the first categories.
- Compare between each sentence.
1. In terms of the rate of poverty relating to gender and age, more than 20% of those under the age of 5 were in poverty for both sexes. 2. Poverty rates then generally declined for men and women until the age of 45 – 54 to relative lows of 7% and 6%, respectively. 3. The exception was that over 20% of women aged 18 – 24 are in poverty, equal to the peak of the youngest demographic. 4. After the age of 54, poverty likelihood for men rose to 9% for those aged 60-64 and then dropped to 5% for those over 75. 5. For women, poverty levels rose more steadily to reach 12% for the oldest age group.
- Write about the final other parts of the graph – include everything!
- Compare the categories.
- Add as much detail as possible.
- Keep comparing…
- This one is a bit long, but better than being too short!
Vocabulary
The pie chart gives statistics for the status of women in poverty and the bar chart breaks down poverty by gender and age demographics in 2008. Looking from an overall perspective, it is readily apparent that the majority of women in poverty are single without children, followed by single with children, and much more distantly by married women with or without offspring. In terms of gender and age, younger people and women were more likely to be in poverty, particularly female young adults and the elderly.
Looking first of all at the pie chart, an overwhelming 54% of women in poverty were unmarried without children. This figure was more than double that of single females with children (26%) and considerably above married women with dependents (12%) and married women lacking any children (8%).
In terms of the rate of poverty relating to gender and age, more than 20% of those under the age of 5 were in poverty for both sexes. Poverty rates then generally declined for men and women until the age of 45 – 54 to relative lows of 7% and 6%, respectively. The exception was that over 20% of women aged 18 – 24 are in poverty, equal to the peak of the youngest demographic. After the age of 54, poverty likelihood for men rose to 9% for those aged 60-64 and then dropped to 5% for those over 75. For women, poverty levels rose more steadily to reach 12% for the oldest age group.
Answers
For extra practice, write an antonym (opposite word) on a piece of paper to help you remember the new vocabulary:
gives statistics for provide data for
status married / have children
in poverty poor, don’t have money
breaks down is categorized by
gender man or woman
age demographics how old they are
Looking from an overall perspective, it is readily apparent that overall
majority most of
single without children not kids, not married
followed by after that
much more distantly by a lot further by
with or without offspring having or not having kids
In terms of concerning
particularly especially
elderly old people
Looking first of all at when it comes to
overwhelming much bigger/stronger
unmarried no husband/wife
figure data
more than double that of 50%+
considerably above much higher than
dependents people who rely on you
lacking not having
the rate of poverty how common it is to be poor
sexes genders
generally declined mostly went down
relative lows near the lowest points
respectively in turn
exception not true in this one case
equal to the same as
peak high point
After the age of past the age
likelihood chance
dropped to fell to
poverty levels rose more steadily to reach how poor people were increase consistently to get to
Pronunciation
Practice saying the vocabulary below and use this tip about Google voice search:
ɡɪvz stəˈtɪstɪks fɔː
ˈsteɪtəs
ɪn ˈpɒvəti
breɪks daʊn
ˈʤɛndə
eɪʤ ˌdɛməˈɡræfɪks
ˈlʊkɪŋ frɒm ən ˈəʊvərɔːl pəˈspɛktɪv, ɪt ɪz ˈrɛdɪli əˈpærənt ðæt
məˈʤɒrɪti
ˈsɪŋɡl wɪˈðaʊt ˈʧɪldrən
ˈfɒləʊd baɪ
mʌʧ mɔː ˈdɪstəntli baɪ
wɪð ɔː wɪˈðaʊt ˈɒfsprɪŋ
ɪn tɜːmz ɒv
pəˈtɪkjʊləli
ˈɛldəli
ˈlʊkɪŋ fɜːst ɒv ɔːl æt
ˌəʊvəˈwɛlmɪŋ
ʌnˈmærɪd
ˈfɪɡə
mɔː ðæn ˈdʌbᵊl ðæt ɒv ɛs
kənˈsɪdərəbᵊli əˈbʌv
dɪˈpɛndənts
ˈlækɪŋ
ðə reɪt ɒv ˈpɒvəti
ˈsɛksɪz
ˈʤɛnərəli dɪˈklaɪnd
ˈrɛlətɪv ləʊz
rɪsˈpɛktɪvli
ɪkˈsɛpʃᵊn
ˈiːkwəl tuː
piːk
ˈɑːftə ði eɪʤ ɒv
ˈlaɪklɪhʊd
drɒpt tuː
ˈpɒvəti ˈlɛvlz rəʊz mɔː ˈstɛdɪli tuː riːʧ
Vocabulary Practice
The pie chart g___________________________r the s_______s of women i________________y and the bar chart b___________n poverty by g________r and a__________________cs in 2008. L__________________________________________________t the m_________y of women in poverty are s_________________n, f_____________y single with children, and m_________________y married women w_____________________g. I_______________f gender and age, younger people and women were more likely to be in poverty, p_______________y female young adults and the e________y.
L______________________t the pie chart, an o_______________g 54% of women in poverty were u____________d without children. This f_______e was m_____________________f single females with children (26%) and c____________________e married women with d_______________s (12%) and married women l________g any children (8%).
In terms of t_____________________y relating to gender and age, more than 20% of those under the age of 5 were in poverty for both s_______s. Poverty rates then g____________d for men and women until the age of 45 – 54 to r___________________s of 7% and 6%, r______________y. The e____________n was that over 20% of women aged 18 – 24 are in poverty, e____________o the p______k of the youngest demographic. A_______________f 54, poverty l____________d for men rose to 9% for those aged 60-64 and then d__________o 5% for those over 75. For women, p___________________________________________h 12% for the oldest age group.
Listening Practice
https://www.youtube.com/watch?v=le79aKbZfLk
Reading Practice
Speaking Practice
Work (Model answer available on my Patreon)
- Are you student or are you working now?
- What do you like about your job/school at the moment?
- What job would you like to do in the future?
Sample Correction
The pie chart compares the proportions of poor women living in different households while the bar chart details similar information related to poverty by gender according to age in the US in 2008.
Looking first at the pie chart, it is clear the single women, and particularly those without dependent children, tended to be poorest compared to both types of married women. Women without dependent children were found to be in poverty at a rate of 54% and single women with children followed distantly at 26%. Much lower were married women with and without dependent children accounting for only 12% and 8%, respectively.
Overall, for the bar chart, poverty rates for men decreased steadily as they got older while the poverty rates for women were higher throughout and fell and rose according to age. The highest figures for men and women were 0-5, with both around 20%. The poverty rate for men then fell steadily to 16% for ages 5 – 17 and so on before there was a spike around age 60-64 at nearly 10% before they continued to fall. For women, there was a spike in poverty at 18 – 24 (nearly 20%) before a steady fall and another sharp increase for 60 to 75 and up, rising to around 13%.


Good