
This is an IELTS writing task 1 sample answer related to the topic of female rates from the real past test.
You can find all the most recent questions from the test for writing here and for speaking here.
This graph was drawn by a student and posted on Facebook – but it accurately reflects the real question from the test.
The most important detail is that this graph shows change over time and that impacts both your general overview and the vocabulary that you will use in your sample answer.
Read more about structures here.
If you are able, please consider supporting my efforts (and receiving exclusive IELTS Ebooks!) by signing up for my Patreon here.
Dave
IELTS Writing Task 1 Sample Answer: Female Birth Rates (Real IELTS Test)
The chart below gives information about the age of women in Australia when they gave birth to their first child in 1966, 1986 and 2006.
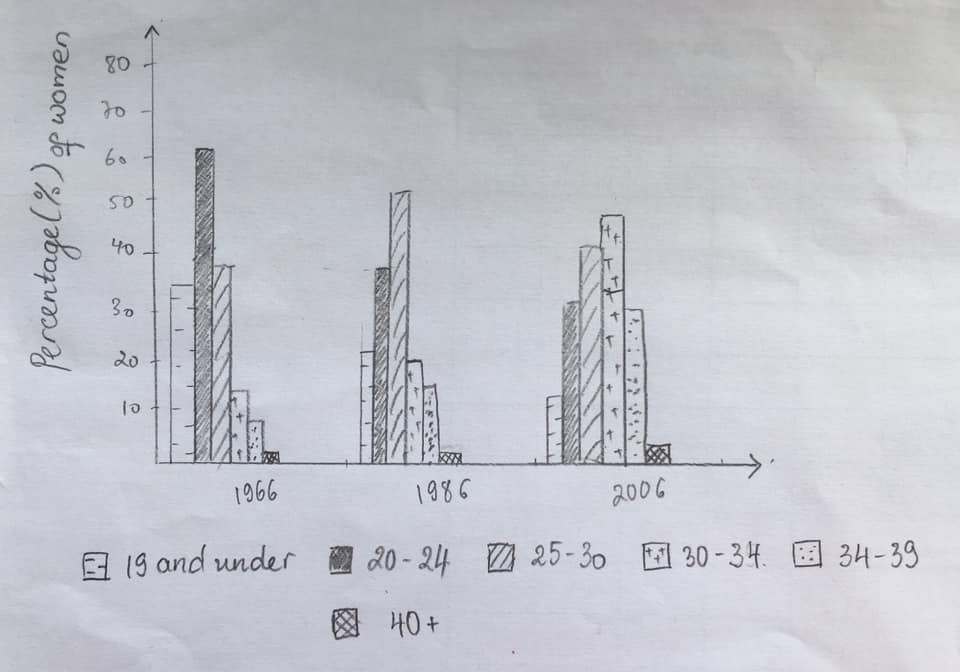
The given graph presents data comparing the ages when women in Australia gave birth in the years 1966, 1986, and 2006. Overall, birth rates for younger women fell while the number of women having children later in life increased greatly. Women aged 30-34 became the largest group and those with the fewest children were under 19 and over 40.
Looking first of all at younger women, both those under 19 and between 20 and 24 declined over the period. The first group started at around 33% in 1966 before falling to just over 20% in 1986 and ending at nearly 15% in 2006. The 20 to 24 group similarly halved from over 60% in 1966 (leading all ages then) to under 40% in 1986 and finishing at just above 30%.
Mothers aged 25 – 30 were the second highest demographic in 1966 (37%) before fluctuating to over 50% and back down to 42% by 2006. Women in the 30-34 age bracket increased more steadily from 12% to 19% and then surged to become the leader at 47%. 34 – 39 year olds generally mirrored this climb rising from 7% to 12% to 29%. In last position throughout was women aged 40+ who increased in proportion steadily but still made up less than 5% of total mothers.
Analysis
1. The given graph presents data comparing the ages when women in Australia gave birth in the years 1966, 1986, and 2006. 2. Overall, birth rates for younger women fell while the number of women having children later in life increased greatly. 3. Women aged 30-34 became the largest group and those with the fewest children were under 19 and over 40.
- Your first sentence should simply paraphrase what the graph shows. This sentence is unimportant so write it fast!
- This is the most important sentence you will write on all of IELTS. For this kind of graph, include the trend (up/down/stay the same) for all areas and some ranking/speed. Read more about overviews here.
1. Looking first of all at younger women, both those under 19 and between 20 and 24 declined over the period. 2. The first group started at around 33% in 1966 before falling to just over 20% in 1986 and ending at nearly 15% in 2006. 3. The 20 to 24 group similarly halved from over 60% in 1966 (leading all ages then) to under 40% in 1986 and finishing at just above 30%.
- For this sentence I start to compare younger women. Make sure you have clear paragraphs and compare as much as possible!
- The next sentence focuses on the specific data – include ALL the data!
- Try to vary up your grammar and vocabulary as much as possible without sounding unnatural.
1. Mothers aged 25 – 30 were the second highest demographic in 1966 (37%) before fluctuating to over 50% and back down to 42% by 2006. 2. Women in the 30-34 age bracket increased more steadily from 12% to 19% and then surged to become the leader at 47%. 3. 34 – 39 year olds generally mirrored this climb rising from 7% to 12% to 29%. 4. In last position throughout was women aged 40+ who increased in proportion steadily but still made up less than 5% of total mothers.
- Now compare the other parts of the chart/graph. For this one I now focus on older women.
- Keep including all the data, varying your vocabulary and grammar.
- You don’t have to include the years each time or it will be too repetitive.
- Make sure that you don’t miss out on any of the categories even if they are minor!
Vocabulary
Try to figure out what the words in bold mean based on the sentences:
The given graph presents data comparing the ages when women in Australia gave birth in the years 1966, 1986, and 2006. Overall, birth rates for younger women fell while the number of women having children later in life increased greatly. Women aged 30-34 became the largest group and those with the fewest children were under 19 and over 40.
Looking first of all at younger women, both those under 19 and between 20 and 24 declined over the period. The first group started at around 33% in 1966 before falling to just over 20% in 1986 and ending at nearly 15% in 2006. The 20 to 24 group similarly halved from over 60% in 1966 (leading all ages then) to under 40% in 1986 and finishing at just above 30%.
Mothers aged 25 – 30 were the second highest demographic in 1966 (37%) before fluctuating to over 50% and back down to 42% by 2006. Women in the 30-34 age bracket increased more steadily from 12% to 19% and then surged to become the leader at 47%. 34 – 39 year olds generally mirrored this climb rising from 7% to 12% to 29%. In last position throughout was women aged 40+ who increased in proportion steadily but still made up less than 5% of total mothers.
Answers
presents gives information about
birth rates the number of babies born
later in life as they get older
greatly a lot
looking first of all at firstly
declined decreased
just over a little above
ending finishing
nearly almost
similarly halved also cut in half
finishing ending up
demographic group
fluctuating inconsistent
bracket group
surged increased a lot
generally mirrored largely had the same trend
last position final spot
proportion percentage
made up comprised of
Pronunciation
ˈprɛznts
bɜːθ reɪts
ˈleɪtər ɪn laɪf
ˈgreɪtli
ˈlʊkɪŋ fɜːst ɒv ɔːl æt
dɪˈklaɪnd
ʤʌst ˈəʊvə
ˈɛndɪŋ
ˈnɪəli
ˈsɪmɪləli hɑːvd
ˈfɪnɪʃɪŋ
ˌdiːməˈgræfɪk
ˈflʌktjʊeɪtɪŋ
ˈbrækɪt
sɜːʤd
ˈʤɛnərəli ˈmɪrəd
lɑːst pəˈzɪʃən
prəˈpɔːʃən
meɪd ʌp
Vocabulary Practice
Try to remember the vocabulary:
The given graph ____________ data comparing the ages when women in Australia gave birth in the years 1966, 1986, and 2006. Overall, ____________ for younger women fell while the number of women having children ____________ increased ____________. Women aged 30-34 became the largest group and those with the fewest children were under 19 and over 40.
________________________ younger women, both those under 19 and between 20 and 24 ____________ over the period. The first group started at around 33% in 1966 before falling to ____________ 20% in 1986 and ____________ at ____________ 15% in 2006. The 20 to 24 group ____________ from over 60% in 1966 (leading all ages then) to under 40% in 1986 and ____________ at just above 30%.
Mothers aged 25 – 30 were the second highest ____________ in 1966 (37%) before ____________ to over 50% and back down to 42% by 2006. Women in the 30-34 age ____________ increased more steadily from 12% to 19% and then ____________ to become the leader at 47%. 34 – 39 year olds ____________ this climb rising from 7% to 12% to 29%. In ____________ throughout was women aged 40+ who increased in ____________ steadily but still ____________ less than 5% of total mothers.
Listening Practice
Watch and review the topic:
Reading Practice
https://family.org.au/the-truth-about-australia-s-birth-rate/


The chart provides information on the ages of women being first time moms between 1966 to 2006. Overall, the majority of women had their first baby later in life, however very few females went through first labor after 40.
In 1966, over 60 per cent women gave birth to their first child between 20 to 24. The number of this category dropped substantially to under 40% in 1986 then continued to decrease to record low at about 30%, which was the third in rank in 2006. Likewise, the proportion of women under 19 decreased steadily from about a third to just over 10% by the end of the period. In contrast, the 30-34 age group showed a considerable increase from approximately 13% in 1966 to just under half of the total count in 2006.
Figures of women in their late twenties fluctuated from around 38% to the top at over 50% in 1986 before declining to the second in rank at about 40% by 2006. It is worth mentioning that despite the slight upward trend, women over 40 accounted for very low percentage at way below 5% during the four decades. (191 words)
Well written Jing!
For at least band 6 for your overview you must have the trend over time as well! Your overview is a good start: https://howtodoielts.com/ielts-writing-task1-band-7-overview/
Be careful of informal vocabulary like ‘way below’ as well!
The bar chart illustrates the percentage of Australian women who delivered birth for the first time based on six age groups in three separate years (1966, 1986 and 2006). In general, age 20-24 was the most prevalent age for mothers gave the first birth in the beginning, but it had been overtaken by the proportion of 30-34-year-old women at the end of the period. There was a downward trend in under 25-year-old mothers, a fluctuation in mid-20s and an increase in over-30s groups.
Based on the chart, in 1966, more than 60% of Australian women, who aged 20-24, delivered their first baby. However, there were fewer mothers in 20 to 24 age who gave birth in th upcoming years, accounted for below 40% in 1986 and just above 30% in 2006. Similarly, the 19-and-under age group had decreased in giving the first birth over a 40-year period, from about 35% to around 12%. By contrast, as much as approximately 38% of mothers delivered their first child in 1966 and the percentage rose to about 50% in 1986, but declined by around 6% in 2006.
On the other hand, the rest of age groups, from 30s to over 40s, underwent a growth over the period shown. The 30-to-34 age group had risen drastically from about 15% to around 47%, exceeded the percentage of 20-24 age group at the end of the period. Furthermore, there were more women who gave the first birth in 34-49 age, accounted for above 10% in 1966 and grew by more than 10% in 2006. Lastly, over-40s women had a higher proportion in delivering their first child, but still managed as the lowest percentage of approximately 3% in 2016.
Strong overview Carry!
Careful with your relative clauses – you over use them sometimes.
You can just say ‘Australian women aged 20-24’
If you use the relative clause you need the helping verb ‘women who were aged 20-24’
You can also say ‘women over the age of 40’ but not over-40s women
I am really thankful for your information. Believe it not not my writing style changed overnight.
I’m so happy to hear that – keep up the hard work!
The bar chart compares different age groups of women when they had their first child in Australia at 20-year intervals between 1966 and 2006. Overall, it is readily apparent women aged 19 and under as well as the 20-24 aged category saw a gradual decline whereas women aged 30-34 and 34-39 category saw a progressive growth. Furthermore, women aged 25-30 peaked in 1986 and, women aged 40 above remained fairly stable.
Though there were three-fifths of women aged 20-24 experiencing their first births in 1960, accounting for the highest proportion overall, it saw a gradual decrease throughout the period to 33% in 1986 and ended at 30%. Women aged 19 and under shared similar trends, decreasing from around 33% to 20% before ending at 10%.
In contrast, women aged 30-34 and 34-39 experienced progressive growth where the former rose from around 11% to 20% and ended at more than 40% which was the greatest proportion of women recorded in 2006 while the latter increased from 9% to 18% to 30%.
Despite there were more than half the proportion of 25-30 aged women gave birth to their first child in 1986 which was a surge from 1966 at around 38%, this figure declined in 2006 to below 40%. Lastly, women above 40 years old increased slightly but remained fairly stable at under 5%.