The Complete Guide to IELTS Cambridge 17
The Complete Guide to IELTS Cambridge 16
The Complete Guide to IELTS Cambridge 15
The Complete Guide to IELTS Cambridge 14
The Complete Guide to IELTS Cambridge 13
IELTS Cambridge 17 Task 1 Essay: Average Weekly Spending
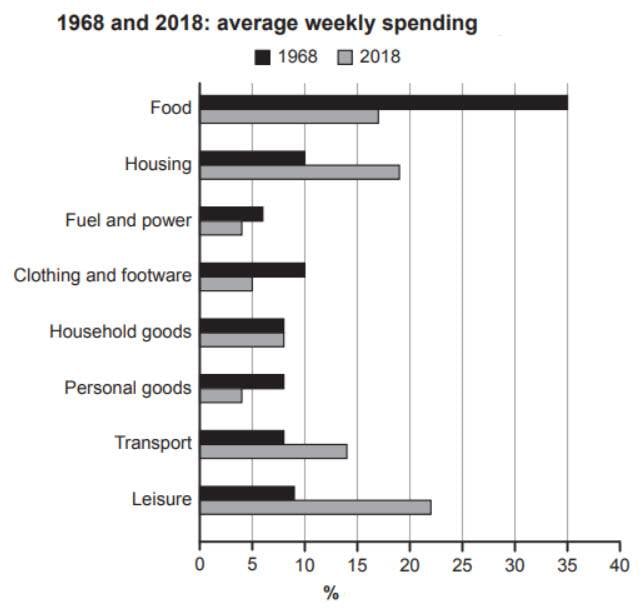
The bar chart provides information about how families in a country spent weekly income in both 1968 and in 2018.

The bar chart details average spending per week for families in a given country in the years 1968 and 2018. Looking from an overall perspective, it is readily apparent that while spending for food, fuel and power, clothing and footware, and personal goods declined, the inverse was true for the remaining categories, with only household goods unchanged. Although spending on food was by far the most common in 1968, by 2018 leisure occupied the majority of the family budget, followed closely by housing.
In 1968, families spent on average 35% of their weekly income on food, greatly outstripping other budgetary concerns, each of which represented between 5% and 10%. Among these, fuel and power was the lowest at 6%.
By 2018, spending patterns diverged more widely. Food represented a still significant 17% of the budget, trailing housing at 19% (a 9% overall rise) and leisure at 22% (a 13% increase). Transport also displayed a notable growth to 14%. Fuel and power, clothing and footware, and personal goods all fell to 4%, 5%, and 4%, respectively. Household goods was the only expense to remain fixed, at 7%.
Analysis
1. The bar chart details average spending per week for families in a given country in the years 1968 and 2018. 2. Looking from an overall perspective, it is readily apparent that while spending for food, fuel and power, clothing and footware, and personal goods declined, the inverse was true for the remaining categories, with only household goods unchanged. 3. Although spending on food was by far the most common in 1968, by 2018 leisure occupied the majority of the family budget, followed closely by housing.
- Paraphrase what the bar chart shows.
- Write a clear overview summarising the differences.
- This one is a little complex so it needs a second sentence for the overview.
1. In 1968, families spent on average 35% of their weekly income on food, greatly outstripping other budgetary concerns, each of which represented between 5% and 10%. 2. Among these, fuel and power was the lowest at 6%.
- Begin writing about the data for the first categories.
- Make sure you compare as much as possible.
1. By 2018, spending patterns diverged more widely. Food represented a still significant 17% of the budget, trailing housing at 19% (a 9% overall rise) and leisure at 22% (a 13% increase). 2. Transport also displayed a notable growth to 14%. Fuel and power, clothing and footware, and personal goods all fell to 4%, 5%, and 4%, respectively. 3. Household goods was the only expense to remain fixed, at 7%.
- Write about the final other parts of the graph – include everything!
- Compare the categories.
- Finish with the rest of the data.
Vocabulary
The bar chart details average spending per week for families in a given country in the years 1968 and 2018. Looking from an overall perspective, it is readily apparent that while spending for food, fuel and power, clothing and footware, and personal goods declined, the inverse was true for the remaining categories, with only household goods unchanged. Although spending on food was by far the most common in 1968, by 2018 leisure occupied the majority of the family budget, followed closely by housing.
In 1968, families spent on average 35% of their weekly income on food, greatly outstripping other budgetary concerns, each of which represented between 5% and 10%. Among these, fuel and power was the lowest at 6%.
By 2018, spending patterns diverged more widely. Food represented a still significant 17% of the budget, trailing housing at 19% (a 9% overall rise) and leisure at 22% (a 13% increase). Transport also displayed a notable growth to 14%. Fuel and power, clothing and footware, and personal goods all fell to 4%, 5%, and 4%, respectively. Household goods was the only expense to remain fixed, at 7%.
Answers
For extra practice, write an antonym (opposite word) on a piece of paper to help you remember the new vocabulary:
details shows
average spending per week amount of money every 7 days spent on average
in a given country in a random nation
Looking from an overall perspective, it is readily apparent that overall
declined decreased
the inverse was true for the opposite is the case for
remaining categories other groups
unchanged remained the same
by far the most common a lot more popular
occupied represented
majority most of
family budget how much money a family spends on average
followed closely by right after that
weekly income money earned each week
greatly outstripping much more than
other budgetary concerns different things to spend money on
each of which all of them
represented stood for
Among these in this group
lowest least
spending patterns ways money is spent
diverged more widely were less similar
represented stood for
significant meaningful
trailing behind
displayed showed
notable growth significant rise
respectively in turn
expense money spent
remain fixed stayed the same
Pronunciation
Practice saying the vocabulary below and use this tip about Google voice search:
ˈdiːteɪlz
ˈævərɪʤ ˈspɛndɪŋ pɜː wiːk
ɪn ə ˈgɪvn ˈkʌntri
ˈlʊkɪŋ frɒm ən ˈəʊvərɔːl pəˈspɛktɪv, ɪt ɪz ˈrɛdɪli əˈpærənt ðæt
dɪˈklaɪnd
ði ɪnˈvɜːs wɒz truː fɔː
rɪˈmeɪnɪŋ ˈkætɪgəriz
ʌnˈʧeɪnʤd
baɪ fɑː ðə məʊst ˈkɒmən
ˈɒkjʊpaɪd
məˈʤɒrɪti
ˈfæmɪli ˈbʌʤɪt
ˈfɒləʊd ˈkləʊsli baɪ
ˈwiːkli ˈɪnkʌm
ˈgreɪtli aʊtˈstrɪpɪŋ
ˈʌðə ˈbʌʤɪtəri kənˈsɜːnz
iːʧ ɒv wɪʧ
ˌrɛprɪˈzɛntɪd
əˈmʌŋ ðiːz
ˈləʊɪst
ˈspɛndɪŋ ˈpætənz
daɪˈvɜːʤd mɔː ˈwaɪdli
ˌrɛprɪˈzɛntɪd
sɪgˈnɪfɪkənt
ˈtreɪlɪŋ
dɪsˈpleɪd
ˈnəʊtəbl grəʊθ
rɪsˈpɛktɪvli
ɪksˈpɛns
rɪˈmeɪn fɪkst
Vocabulary Practice
The bar chart d_______s a___________________________k for families i___________________y in the years 1968 and 2018. L___________________________________________________________t while spending for food, fuel and power, clothing and footware, and personal goods d_________d, t_____________________________r the r_________________s, with only household goods u_______________d. Although spending on food was b________________________n in 1968, by 2018 leisure o__________d the m_________y of the f_____________t, f____________________y housing.
In 1968, families spent on average 35% of their w___________e on food, g_______________________________g o______________________s, e___________________________d between 5% and 10%. A____________e, fuel and power was the l_________t at 6%.
By 2018, s______________________s d____________________y. Food r_________________d a still s_____________t 17% of the budget, t____________g housing at 19% (a 9% overall rise) and leisure at 22% (a 13% increase). Transport also d__________d a n____________________h to 14%. Fuel and power, clothing and footware, and personal goods all fell to 4%, 5%, and 4%, r________________y. Household goods was the only e__________e to r______________d, at 7%.
Listening Practice
Reading Practice
https://www.nerdwallet.com/article/finance/how-to-budget
Speaking Practice
Shopping
- What do you usually shop for?
- Do you often go to malls?
- Do you shop online a lot?
- How common are shopping centers in your country?
Writing Practice


0 Comments