This is an IELTS writing task 1 sample answer essay on the topic of consumption of vegetables and fish (a bar chart) from the real IELTS exam.
You can read the complete guide for Cambridge 16 here along with sample answers and essays.
Please consider supporting my efforts to creative high quality IELTS materials for students around the world by signing up for my Patreon (and so you won’t miss out on any of my exclusive IELTS Ebooks)!
Dave
IELTS Essay Task 1: Consumption of Vegetables and Fish
The bar chart illustrates the number of people in the UK eating more than 5 portions of vegetables and fish per day.
Summarise the information by selecting and reporting the main features, and make comparisons where relevant.
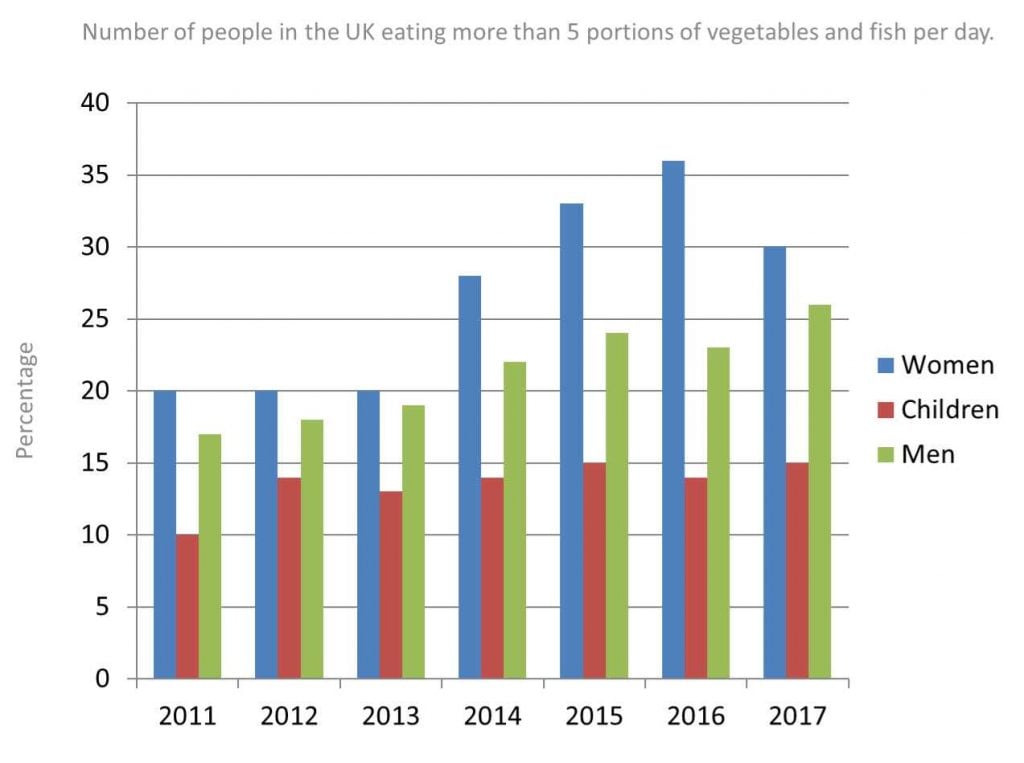
The bar chart illustrates statistics concerning individuals in the UK consuming 5 or more portions of vegetables and fish per day from 2011 to 2017. Looking from an overall perspective, it is readily apparent that percentages for women, children and men all rose over the period and women had the highest numbers throughout. The increase for children, comparatively, was modest.
Women began the period with 20% consuming more than 5 portions of vegetables and fish a day and this figure was stable until 2013 when it began to rise precipitously to eventually reach a high of 36% in 2016, before a fall to 30% to end the period. The numbers for males finished slightly lower at 26%, however their growth was steadier, rising in each year besides 2016 from a starting point of 16% in 2011.
The figures for children were much lower to begin (10%), preceding a relative surge to 14% the next year. Percentages then fluctuated around 14% and finished at a peak of 15% by the end of the period.
Analysis
1. The bar chart illustrates statistics concerning individuals in the UK consuming 5 or more portions of vegetables and fish per day from 2011 to 2017. 2. Looking from an overall perspective, it is readily apparent that percentages for women, children and men all rose over the period and women had the highest numbers throughout. 3. The increase for children, comparatively, was modest.
- Paraphrase what the bar chart shows.
- Write a clear overview summarising the differences.
- You might need a second sentence for your overview.
1. Women began the period with 20% consuming more than 5 portions of vegetables and fish a day and this figure was stable until 2013 when it began to rise precipitously to eventually reach a high of 36% in 2016, before a fall to 30% to end the period. 2. The numbers for males finished slightly lower at 26%, however their growth was steadier, rising in each year besides 2016 from a starting point of 16% in 2011.
- Begin writing about the data for the first category.
- Describe the next area and compare it to the area before.
1. The figures for children were much lower to begin (10%), preceding a relative surge to 14% the next year. 2. Percentages then fluctuated around 14% and finished at a peak of 15% by the end of the period.
- Write about the final other parts of the bar chart – include everything!
- There is a lot of data in this one but try to get to all of it.
Vocabulary
What do the words in bold below mean? Take some notes on a piece of paper to aid your memory:
The bar chart illustrates statistics concerning individuals in the UK consuming 5 or more portions of vegetables and fish per day from 2011 to 2017. Looking from an overall perspective, it is readily apparent that percentages for women, children and men all rose over the period and women had the highest numbers throughout. The increase for children, comparatively, was modest.
Women began the period with 20% consuming more than 5 portions of vegetables and fish a day and this figure was stable until 2013 when it began to rise precipitously to eventually reach a high of 36% in 2016, before a fall to 30% to end the period. The numbers for males finished slightly lower at 26%, however their growth was steadier, rising in each year besides 2016 from a starting point of 16% in 2011.
The figures for children were much lower to begin (10%), preceding a relative surge to 14% the next year. Percentages then fluctuated around 14% and finished at a peak of 15% by the end of the period.
Answers
Try to write down or think of an antonym/opposite word for further practice:
illustrates shows
statistics data
concerning as it relates to
the UK England
consuming eating
portions amount of food
per day each day
Looking from an overall perspective, it is readily apparent that overall
rose increased
period time in question
highest numbers biggest figures
throughout the whole time
comparatively compared/relative to
modest small
began the period started
a day each day
stable no chance
when as
rise precipitously grow a lot
eventually in the end
reach a high of get to a top point of
before a fall preceding a decrease
to end the period to finish the time
slightly lower a little less
growth rise
steadier with less fluctuation
besides also
from a starting point of beginning at
much lower a lot less
relative surge compared to other rises, a large rise
the next year the following year
fluctuated was erratic
at a peak of to a high point of
Pronunciation
Practice saying the words below using this tip with Google voice dictation:
ˈɪləstreɪts
stəˈtɪstɪks
kənˈsɜːnɪŋ
ðə juː-keɪ
kənˈsjuːmɪŋ
ˈpɔːʃənz
pɜː deɪ
ˈlʊkɪŋ frɒm ən ˈəʊvərɔːl pəˈspɛktɪv, ɪt ɪz ˈrɛdɪli əˈpærənt ðæt
rəʊz
ˈpɪərɪəd
ˈhaɪɪst ˈnʌmbəz
θru(ː)ˈaʊt
kəmˈpærətɪvli
ˈmɒdɪst
bɪˈgæn ðə ˈpɪərɪəd
ə deɪ
ˈsteɪbl
wɛn
raɪz prɪˈsɪpɪtəsli
ɪˈvɛnʧəli
riːʧ ə haɪ ɒv
bɪˈfɔːr ə fɔːl
tuː ɛnd ðə ˈpɪərɪəd
ˈslaɪtli ˈləʊə
grəʊθ
ˈstɛdɪə
bɪˈsaɪdz
frɒm ə ˈstɑːtɪŋ pɔɪnt ɒv
mʌʧ ˈləʊə
ˈrɛlətɪv sɜːʤ
ðə nɛkst jɪə
ˈflʌktjʊeɪtɪd
æt ə piːk ɒv
Vocabulary Practice
Remember and fill in the blanks. Note it on a piece of paper so you can remember better:
The bar chart i________________s s______________s c______________g individuals in t______K c______________g 5 or more p__________s of vegetables and fish p_________y from 2011 to 2017. L____________________________________________________t percentages for women, children and men all r_____e over the p_______d and women had the h______________s t______________t. The increase for children, c_______________y, was m_________t.
Women b___________________d with 20% consuming more than 5 portions of vegetables and fish a________y and this figure was s__________e until 2013 w______n it began to r_________________y to e__________________________f 36% in 2016, b_____________l to 30% t__________________d. The numbers for males finished s_________________r at 26%, however their g_________h was s___________r, rising in each year b__________s 2016 f________________________f 16% in 2011.
The figures for children were m__________r to begin (10%), preceding a r________________e to 14% t_______________r. Percentages then f___________d around 14% and finished a_________________f 15% by the end of the period.
Listening Practice
Listen to the related topic below and practice with these activities:
Reading Practice
Read more and use these ideas to practice:
https://www.healthline.com/nutrition/meal-plans
Speaking Practice
Practice with the following related questions from the real IELTS speaking exam:
Sweets
- Do you like sweets?
- Did you like sweets when you were younger?
- What kind of sweet foods are popular in your country?
Writing Practice
Practice with the related table below and then check with my sample answer:


Hi Dave,
please kindly check my answer below 🙂 Thank you so much!
The given bar chart illustrates the percentage of people consuming 5 or more portions of vegetables and fish over the course of 7 years starting from 2011.
In general, the trends of people eating more than 5 portions of vegetables and fish always increased in the most of the period. Additionally, women had the highest numbers while children had the lowest numbers throughout the period.
Women started at exactly 20 percent in 2011 and plateaued until 2013, then rising consistently except for a quite significant drop from just over 35% to 30% during 2016 – 2017. While both men and women modes were relatively similar, there was some variance, especially during 2015-2017, when the number of men consuming 5 or more portions of vegetables and fish fluctuated slightly around 25%.
Turning to children, the percentage fluctuated over the entire period and it never rose above 15% and did not go under 10%.
Nice work, Marsha!
Some issues with grammar but nice overview. There could be a bit more data – for men especially.
Keep working hard – good start!
The only group to see no change in the percentages of British consuming more than 5 portions of vegetables and fish a day was women from 2011 to 2013 when precisely one in five females completed this action
The rate of women also reach a peak of 37% in 2016
For their counterparts, however, there was a continued increase from 16% to 26% except for a dip to 22% in 2016
Children saw an upward fluctuation, starting much lower at 10% and finishing at its highest point of 15% by the end of the period
Some nice sentence!
For a full essay, you’ll have to make it longer and put in some paragraphs, naturally.