
This is an IELTS writing task 1 sample answer essay related to water usage in Australia.
If you want to support my efforts to write these essays and also receive my exclusive Ebooks, check out my Patreon!
Dave
IELTS Essay Task 1 Water Usage Australia
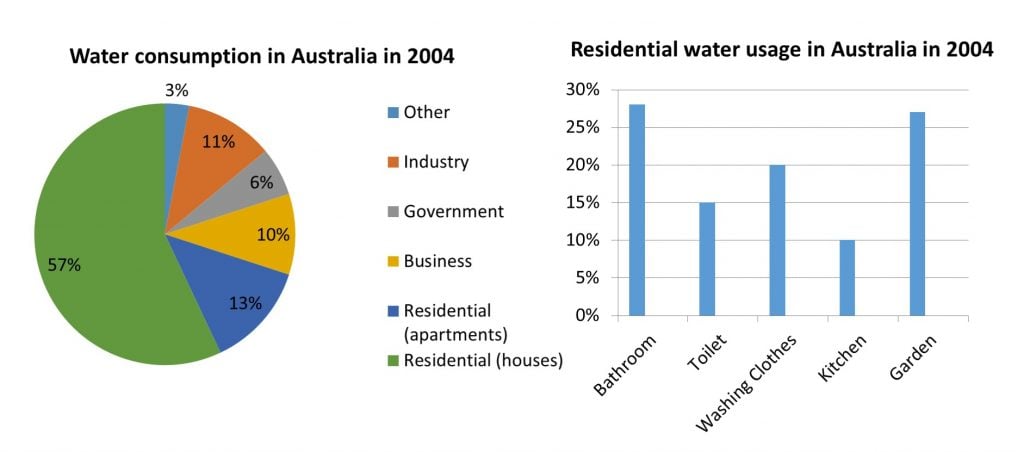
The charts show the total usage proportions for water in Australia and a breakdown of its residential purposes. Looking from an overall perspective, it is readily apparent that the vast majority of water is dedicated to houses, followed by apartments, industry, businesses and finally other. In terms of the residential use, it is mainly for bathrooms and gardens, with lower numbers for washing clothes, toilets and kitchens.
Looking first of all at the pie chart, houses represent 57% of total water usage, far surpassing apartments at 13%, industry at 11%, business 10%, government 6%, and lastly other (3%).
The bar chart delineates the uses of residential water, including both homes and apartments. Nearly 30% of all water was used for bathrooms, the highest figure, while gardens was slightly lower at 26%. Washing clothes translates to 20% of usage, followed by toilets at 15%, and kitchen use totaling just 10%.
Analysis
1. The charts show the total usage proportions for water in Australia and a breakdown of its residential purposes. 2. Looking from an overall perspective, it is readily apparent that the vast majority of water is dedicated to houses, followed by apartments, industry, businesses and finally other. 3. In terms of the residential use, it is mainly for bathrooms and gardens, with lower numbers for washing clothes, toilets and kitchens.
- Paraphrase what the charts show.
- Write an overview of the first chart.
- And the second one! Read more about overviews here.
1. Looking first of all at the pie chart, houses represent 57% of total water usage, far surpassing apartments at 13%, industry at 11%, business 10%, government 6%, and lastly other (3%).
- Describe the data fully.
1. The bar chart delineates the use of residential water, including both homes and apartments. 2. Nearly 30% of all water was used for bathrooms, the highest figure, while gardens was slightly lower at 26%. 3. Washing clothes translates to 20% of usage, followed by toilets at 15%, and kitchen use totaling just 10%.
- Move on to the other graph.
- Describe the data.
- Make sure you don’t miss out on any data.
Vocabulary
What do the words in bold below mean?
The charts show the total usage proportions for water in Australia and a breakdown of its residential purposes. Looking from an overall perspective, it is readily apparent that the vast majority of water is dedicated to houses, followed by apartments, industry, businesses and finally other. In terms of the residential use, it is mainly for bathrooms and gardens, with lower numbers for washing clothes, toilets and kitchens.
Looking first of all at the pie chart, houses represent 57% of total water usage, far surpassing apartments at 13%, industry at 11%, business 10%, government 6%, and lastly other (3%).
The bar chart delineates the uses of residential water, including both homes and apartments. Nearly 30% of all water was used for bathrooms, the highest figure, while gardens was slightly lower at 26%. Washing clothes translates to 20% of usage, followed by toilets at 15%, and kitchen use totaling just 10%.
Answers
total usage proportions complete percentages
breakdown detailed
residential purposes how it is used for homes
looking from an overall perspective, it is readily apparent in general
vast majority most of
dedicated to used for
followed by then
in terms of as it relates to
mainly mostly
lower numbers not as high
looking first of all at firstly
represent are
far surpassing a lot above
lastly finally
delineates describes
nearly almost
highest figure biggest number
slightly lower a little less
translates means
followed by next
totaling just all together only
Pronunciation
ˈtəʊtl ˈjuːzɪʤ prəˈpɔːʃənz
ˈbreɪkˌdaʊn
ˌrɛzɪˈdɛnʃəl ˈpɜːpəsɪz
ˈlʊkɪŋ frɒm ən ˈəʊvərɔːl pəˈspɛktɪv, ɪt ɪz ˈrɛdɪli əˈpærənt
vɑːst məˈʤɒrɪti
ˈdɛdɪkeɪtɪd tuː
ˈfɒləʊd baɪ
ɪn tɜːmz ɒv
ˈmeɪnli
ˈləʊə ˈnʌmbəz
ˈlʊkɪŋ fɜːst ɒv ɔːl æt
ˌrɛprɪˈzɛnt
fɑː sɜːˈpɑːsɪŋ
ˈlɑːstli
dɪˈlɪnɪeɪts
ˈnɪəli
ˈhaɪɪst ˈfɪgə
ˈslaɪtli ˈləʊə
trænsˈleɪts
ˈfɒləʊd baɪ
ˈtəʊtlɪŋ ʤʌst
Vocabulary Practice
The charts show the total usage proportions for water in Australia and a breakdown of its residential purposes. Looking from an overall perspective, it is readily apparent that the vast majority of water is dedicated to houses, followed by apartments, industry, businesses and finally other. In terms of the residential use, it is mainly for bathrooms and gardens, with lower numbers for washing clothes, toilets and kitchens.
Looking first of all at the pie chart, houses represent 57% of total water usage, far surpassing apartments at 13%, industry at 11%, business 10%, government 6%, and lastly other (3%).
The bar chart delineates the uses of residential water, including both homes and apartments. Nearly 30% of all water was used for bathrooms, the highest figure, while gardens was slightly lower at 26%. Washing clothes translates to 20% of usage, followed by toilets at 15%, and kitchen use totaling just 10%.
Listening Practice
Learn more about water scarcity below and practice with these activities:
Reading Practice
Read about water in Australia and practice with these ideas:
Speaking Practice
Practice with the following questions from the real IELTS speaking exam:
Water
- Do you drink a lot of water?
- Do you prefer bottled or tap water?
- Did you drink a lot of water when you were younger?
- Would you say that bottled water is expensive in your country?
Writing Practice
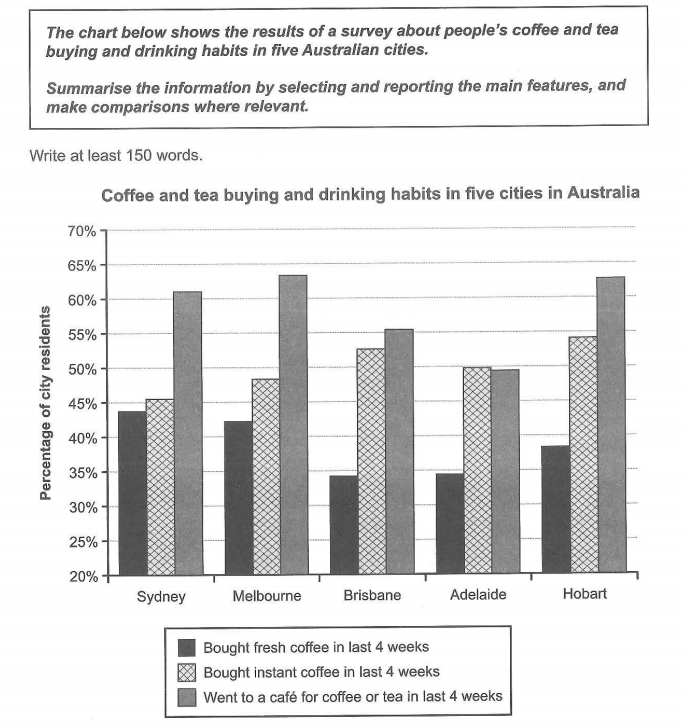
Write about the chart below and then check with my sample answer:


Hj
Hi!
hello
hiiiiiiiiiiiiiiiiiiiiiiiiiiiiiiiiiiiiiiiiiiiiiiiiiiiiiiiiiiiiiiiiiiiiiiiiiiiiiiiiii
Hi there!
Hiiii
The charts show the amount of water consumed in Australia for 6 purposes and a breakdown of its residential use, in 2004.
In general, more water was dedicated to houses and apartments than the other sectors with most of the domestic usage on bathroom and garden.
Residential purposes accounted for 70% of the total water usage with the percentage for houses by far surpassing apartments’ at 57%. The proportions of industry and business usage were almost exactly the same at 11% and 10%, respectively whereas water consumption for government doubled that for the other purposes at 3%.
Turning to the bar chart, while one single household task, laundering, made up a fifth of the total domestic use, the combined percentages of activities completed on the toilet (15%) and the kitchen (10%) was only negligibly higher. Finally, the other two categories represent nearly identical usage, with figures of 28% for the bathroom and 27% for gardening.
Great work!
Really accurate grammar and a nice overview – does it cover all categories?
The charts illustrate the total usage proportion of water in Australia and the breakdown of its residential water consumption for different purposes in 2004.
Looking from an overall perspective, it is readily apparent that the dominant user of water was residential houses, followed by apartment residents, business, industry, government and finally other. In terms of residential water consumption, the vast majority of water was used in bathroom and garden, while the lowest figure was in kitchen.
Looking first at the pie chart, more than a half of water use was by residential houses. It was four times as much as the consumption of residential apartments, industry and business (13%, 11% and 10% respectively). The government water usage was only 6%, which left only 3% of total to Other.
The given bar chart gives data about the purposes of residential water in both houses and apartments. More than a quarter of water usage was used in bathroom and garden. Washing clothes accounted for 20% of total domestic use, followed by the toilet with 15%. Kitchen was the lowest water consumption area, with only 10% of total.
Great work, Kathy!
Hi Dave, are there any grammatical errors I should pay attention to? My work will fall in which range of the score band, could you mark it please 😀
Thank you so much.