
This is an IELTS writing task 1 sample answer essay on the topic of oil use in a line chart.
Sign up here for my Patreon so you don’t miss out on my exlusive PDFs!
Dave
IELTS Essay Task 1: Oil Use
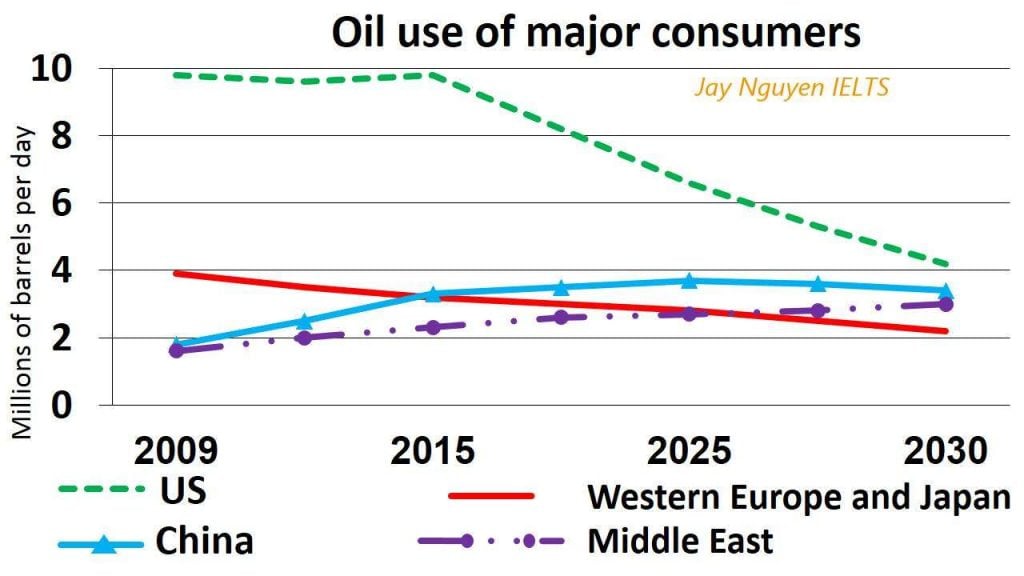
The line chart details the numbers for oil use in the US, China, the Middle East, and Western Europe and Japan from 2009 to 2030. Looking from an overall perspective, it is readily apparent that despite the US consuming the most oil throughout, this is projected to fall dramatically. Western Europe and Japan’s numbers will continue to decline to become the lowest by the end of the period while consumption will increase steadily in the Middle East and China.
Looking first of all at the United States, consumption began by hovering at just under 10 million from 2009 to 2015 though a precipitous fall is forecast to just over 4 million by 2030. Western Europe and Japan are also predicted to maintain a negative trend, which started at under 4 million barrels a day in 2009 and will end at just over 2 million.
The patterns are similar for China and the Middle East with both commencing at just under 2 million barrels. The former then rose quickly to slightly below 4 million by the present period and is expected to plateau and decline marginally at the end of the time surveyed. The latter will undertake a steadier rise and both regions will likely intersect at around 3 million barrels by 2030.
Analysis
1. The line chart details the numbers for oil use in the US, China, the Middle East, and Western Europe and Japan from 2009 to 2030. 2. Looking from an overall perspective, it is readily apparent that despite the US consuming the most oil throughout, this is projected to fall dramatically. 3. Western Europe and Japan’s numbers will continue to decline to become the lowest by the end of the period while consumption will increase steadily in the Middle East and China.
- Paraphrase what the graph shows.
- Write a general overview covering the full trends.
- Make sure everything is included. Read about general overviews here.
1. Looking first of all at the United States, consumption began by hovering at just under 10 million from 2009 to 2015 though a precipitous fall is forecast to just over 4 million by 2030. 2. Western Europe and Japan are also predicted to maintain a negative trend, which started at under 4 million barrels a day in 2009 and will end at just over 2 million.
- Begin with one of the areas.
- Make sure that you always compare and always include all the data.
1. The patterns are similar for China and the Middle East with both commencing at just under 2 million barrels. 2. The former then rose quickly to slightly below 4 million by the present period and is expected to plateau and decline marginally at the end of the time surveyed. 3. The latter will undertake a steadier rise and both regions will likely intersect at around 3 million barrels by 2030.
- Move on to the other areas.
- Fully describe the data.
- Make sure that mention any overtaking or intersections.
Vocabulary
What do the words in bold below mean?
The line chart details the numbers for oil use in the US, China, the Middle East, and Western Europe and Japan from 2009 to 2030. Looking from an overall perspective, it is readily apparent that despite the US consuming the most oil throughout, this is projected to fall dramatically. Western Europe and Japan’s numbers will continue to decline to become the lowest by the end of the period while consumption will increase steadily in the Middle East and China.
Looking first of all at the United States, consumption began by hovering at just under 10 million from 2009 to 2015 though a precipitous fall is forecast to just over 4 million by 2030. Western Europe and Japan are also predicted to maintain a negative trend, which started at under 4 million barrels a day in 2009 and will end at just over 2 million.
The patterns are similar for China and the Middle East with both commencing at just under 2 million barrels. The former then rose quickly to slightly below 4 million by the present period and is expected to plateau and decline marginally at the end of the time surveyed. The latter will undertake a steadier rise and both regions will likely intersect at around 3 million barrels by 2030.
Answers
details describes
oil use petrol consumption
looking from an overall perspective, it is readily apparent that in general
consuming using
throughout the whole time
projected expected to
fall dramatically decrease a lot
continue to decline keep decreasing
lowest by the end of the period the least by 2030
consumption use
increase steadily going up at regular intervals
looking first of all at considering first
hovering remaining around
precipitous fall steep decline
forecast look forward
just over a bit above
maintain a negative trend continue to decline
started at began at
million barrels a day the amount of oil each day used
end at finished at
patterns trends
commencing beginning at
former mentioned first
rose quickly increased fast
slightly below a little less
by the present period right now
plateau rise and level off
decline marginally decrease a little bit
end of the time surveyed end of the period in question
undertake experience
steadier rise increase at regular intervals
regions parts of the world
intersect meet
Pronunciation
ˈdiːteɪlz
ɔɪl juːz
ˈlʊkɪŋ frɒm ən ˈəʊvərɔːl pəˈspɛktɪv, ɪt ɪz ˈrɛdɪli əˈpærənt ðæt
kənˈsjuːmɪŋ
θru(ː)ˈaʊt
prəˈʤɛktɪd
fɔːl drəˈmætɪk(ə)li
kənˈtɪnju(ː) tuː dɪˈklaɪn
ˈləʊɪst baɪ ði ɛnd ɒv ðə ˈpɪərɪəd
kənˈsʌm(p)ʃən
ˈɪnkriːs ˈstɛdɪli
ˈlʊkɪŋ fɜːst ɒv ɔːl æt
ˈhɒvərɪŋ
prɪˈsɪpɪtəs fɔːl
ˈfɔːkɑːst
ʤʌst ˈəʊvə
meɪnˈteɪn ə ˈnɛgətɪv trɛnd
ˈstɑːtɪd æt
ˈmɪljən ˈbærəlz ə deɪ
ɛnd æt
ˈpætənz
kəˈmɛnsɪŋ
ˈfɔːmə
rəʊz ˈkwɪkli
ˈslaɪtli bɪˈləʊ
baɪ ðə ˈprɛznt ˈpɪərɪəd
ˈplætəʊ
dɪˈklaɪn ˈmɑːʤɪnəli
ɛnd ɒv ðə taɪm sɜːˈveɪd
ˌʌndəˈteɪk
ˈstɛdɪə raɪz
ˈriːʤənz
ˌɪntə(ː)ˈsɛkt
Vocabulary Practice
Remember and fill in the blanks:
The line chart d___________s the numbers for o_______e in the US, China, the Middle East, and Western Europe and Japan from 2009 to 2030. L_________________________________________t despite the US c____________g the most oil t______________t, this is p____________d to f_________________y. Western Europe and Japan’s numbers will c__________________e to become the l_____________________________d while c______________n will i_____________________y in the Middle East and China.
L_______________________t the United States, consumption began by h____________g at just under 10 million from 2009 to 2015 though a p________________l is f___________t to j____________r 4 million by 2030. Western Europe and Japan are also predicted to m____________________d, which s___________t under 4 m______________________y in 2009 and will e______t just over 2 million.
The p__________s are similar for China and the Middle East with both c_______________g at just under 2 million barrels. The f___________r then r________________y to s_____________w 4 million b____________________d and is expected to p___________u and d____________________y at the e________________________d. The latter will u____________e a s_____________e and both r_________s will likely i____________t at around 3 million barrels by 2030.
Listening Practice
Learn more about oil consumption below:
https://www.youtube.com/watch?v=iImChz9sUbg
Reading Practice
And find your own country below:
https://www.worldometers.info/oil/oil-consumption-by-country/
Speaking Practice
Practice with the following questions related to public transport:
Public Transport
- Does your city use a lot of public transport?
- When was the last time you used public transport?
- Will you still use public transport in the future?
- What would you like to change about the public transport in your city?
Writing Practice
Write about another line chart then check with my sample answer:


Hi
thanks for your writting
i am preparing for IELTS exam, and i learn from theme
Great – keep up the hard word, Negin!
Sir, can u plzz share prediction of 21st jan exam
Hello, actually this page is useful for me could u check my writing tasks I don’t know where I’m lacking
Sure! Send me a message here and we can talk: Facebook.com/davelanghowtodoielts
Sure, Vikas, send me a message on Facebook and we can talk personally!