This is an IELTS Writing Task 1 Sample Answer from IELTS Cambridge 14 showing pie charts of what makes up breakfast, lunch, dinner and snacks in the average meal in the USA.
If you want to get my best materials and support me, please sign up for my exclusive IELTS Ebooks here on Patreon.
The first thing to notice about this graph is that it does not show time.
That means that you won’t be writing about trends, increase, decrease, etc.
Instead, it is basically all comparision of different percentages/proportions. I think that makes these graphs easier to write about.
The trickiest part is the general overview and the structure of the paragraphs.
Read the essay and analysis below to see how I handled these two problems!
If you want to read some more sample answers from IELTS Cambridge 14, you can read a task 2 about unsatisfactory lives here.
Enjoy!
Dave
IELTS Writing Task 1 Sample Answer: Percentages of Sodium, Saturated Fats, Sugars in Meals (IELTS Cambridge 14)
The charts below show the average percentages in typical meals of three types of nutrients, all of which may be unhealthy if eaten too much.
Summarise the information by selecting and reporting the main features,
and make comparisons where relevant.
IELTS Cambridge 14 Pie Charts
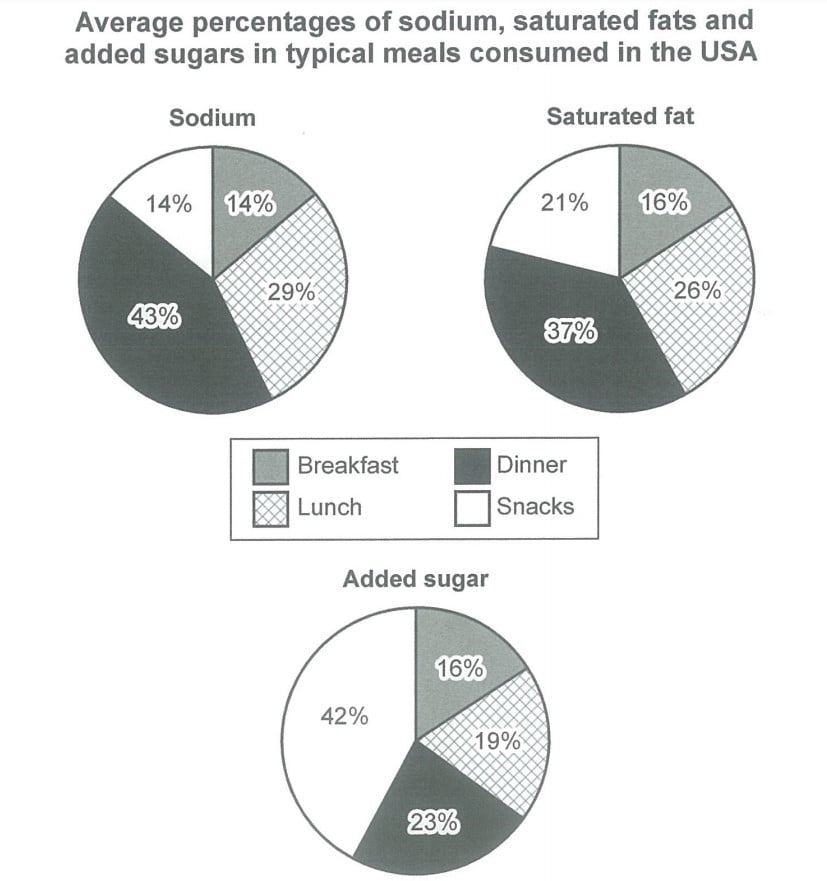
The graph shows how much sodium, saturated fat and added sugars were consumed in the average meal in the United States. Looking from an overall perspective, it is readily apparent that the majority of sodium and fat were consumed at dinner, while most sugar was eaten in snacks. Lunch also tended to be salty and have a lot of fat while breakfast had the lowest percentages for all three nutrients.
Dinner and lunch had roughly similar, large proportions for both sodium (43% for dinner and 29% for lunch) and saturated fat (37% for dinner and 26% for lunch). The amount of sugar in an average meal for dinner and lunch was much lower at 23% and 19%, respectively.
Turning to breakfast and snacks, which also had comparable percentages, they were both made up of 14% sodium. For saturated fats, snacks contained 21% and breakfast was slightly lower at 16%. In terms of sugar, there was the greatest disparity with 42% of snacks being sugary and just 16% of breakfasts being made up of sugar.
IELTS Examiner Sample Answer Analysis
1. The graph shows how much sodium, saturated fat and added sugars were consumed in the average meal in the United States. 2. Looking from an overall perspective, it is readily apparent that the majority of sodium and fat were consumed at dinner, while most sugar was eaten in snacks. 3. Lunch also tended to be salty and have a lot of fat while breakfast had the lowest percentages for all three nutrients.
1. The first sentence of the essay should just paraphrase the topic – don’t waste too much time on this sentence.
2-3. Next is the most most important sentence of your essay – your general overview. For this type of graph just make a comparision of ALL the different areas. Read more about overviews here.
1. Dinner and lunch had roughly similar, large proportions for both sodium (43% for dinner and 29% for lunch) and saturated fat (37% for dinner and 26% for lunch). 2. The amount of sugar in an average meal for dinner and lunch was much lower at 23% and 19%, respectively.
1. The first sentence contains the meals I will talk about. I chose to focus on lunch and dinner first and then in the next paragraph breakfast and snacks because they have more similar numbers. It would have been harder to write about the ingredients instead of the meals. But it is possible! Just make sure you have some kind of a logical structure for your paragraphs!
2. The second sentence finishes givin the data. Always include the data or you will get band 5 for task achievement!
1. Turning to breakfast and snacks, which also had comparable percentages, they were both made up of 14% sodium. 2. For saturated fats, snacks contained 21% and breakfast was slightly lower at 16%. 3. In terms of sugar, there was the greatest disparity with 42% of snacks being sugary and just 16% of breakfasts being made up of sugar.
1. The first sentence focuses on the other meals, gives my reason for focusing on them and describes the data.
2. My next sentence continues to describe and compare the data for lunch and snacks.
3. My final sentence finishes the data. You don’t need a conclusion! You can include one if you feel that your overview needs a bit more detail though…
Sample Answer Vocabulary
Try to figure out what the words in bold mean from the sentences. Write down your guesses and then check your answers below.
The graph shows how much sodium, saturated fat and added sugars were consumed in the average meal in the United States. Looking from an overall perspective, it is readily apparent that the majority of sodium and fat were consumed at dinner, while most sugar was eaten in snacks. Lunch also tended to be salty and have a lot of fat while breakfast had the lowest percentages for all three nutrients.
Dinner and lunch had roughly similar, large proportions for both sodium (43% for dinner and 29% for lunch) and saturated fat (37% for dinner and 26% for lunch). The amount of sugar in an average meal for dinner and lunch was much lower at 23% and 19%, respectively.
Turning to breakfast and snacks, which also had comparable percentages, they were both made up of 14% sodium. For saturated fats, snacks contained 21% and breakfast was slightly lower at 16%. In terms of sugar, there was the greatest disparity with 42% of snacks being sugary and just 16% of breakfasts being made up of sugar.
Answers:
consumed: eaten
average meal: the amount that people normally eat
readily apparent: very clear
majority: most of
tended to be: usually did
nutrients: the compounds that make up foods
roughly similar: not that different
respectively: in turn/for each category
turning to: looking at the next area
comparable: similiar
made up of: composed/consisting of
slightly lower: a little bit less
greatest disparity: biggest difference
sugary: full of sugar/sweet
Pronunciation:
kənˈsjuːmd
ˈævərɪʤ miːl
ˈrɛdɪli əˈpærənt
məˈʤɒrɪti
ˈtɛndɪd tuː biː
ˈnjuːtrɪənts.
ˈrʌfli ˈsɪmɪlə
rɪsˈpɛktɪvli.
ˈtɜːnɪŋ tuː
ˈkɒmpərəbl
meɪd ʌp ɒv
ˈslaɪtli ˈləʊə
ˈgreɪtɪst dɪsˈpærɪti
ˈʃʊgəri
Vocabulary Practice
Remember and fill in the blanks:
The graph shows how much sodium, saturated fat and added sugars were ___________ in the ___________ in the United States. Looking from an overall perspective, it is ___________ that the ___________ of sodium and fat were consumed at dinner, while most sugar was eaten in snacks. Lunch also ___________ salty and have a lot of fat while breakfast had the lowest percentages for all three ___________.
Dinner and lunch had ___________, large proportions for both sodium (43% for dinner and 29% for lunch) and saturated fat (37% for dinner and 26% for lunch). The amount of sugar in an average meal for dinner and lunch was much lower at 23% and 19%, ___________.
___________ breakfast and snacks, which also had ___________percentages, they were both ___________ 14% sodium. For saturated fats, snacks contained 21% and breakfast was ___________ at 16%. In terms of sugar, there was the ___________ with 42% of snacks being ___________and just 16% of breakfasts being made up of sugar.
Links from YouTube and Articles
School Lunches Around the World
Profiting from School Lunches
This is 200 Calories
USA vs South Korean Food
Comment below – What do people in your country usually eat for breakfast/lunch/dinner/snacks?
A lot of people will have…
The biggest lunch here is …
For ________, most people get something like…
It’s really common in _______ to…


I feel you wrote quite cofusing
Sorry to hear that! Which part was confusing?
Exactly
yes, it’s good
Thanks, John!
Hi Dave,
Do we need to write all the graphs or charts in the simple past, even if there is no time given? In the above example, it was only general usage, they didn’t mention any year. So, in this case, can we use present tense.
Yes, if there is not time mentioned then present tense is absolutely fine.
Hi, Dave:)
I just wanna let you know
the last part of sentences <there was the greatest disparity with 42% of snacks being sugary and just 18% of breakfasts being made up of sugar>
sugar is 16% in breakfast.
always thanks.
Thank you – I will edit that, Jiwon!
Hi, Thank you so much for your answers bro. So much important for me. I usually use linking words such as moreover, apart from that, however and meanwhile. Is it possible to apply in these in your answer. I’m used to it.
Hi Radisha, you should use them sparingly. Notice that for the higher band scores for cohesion and coherence (band 8+), there is no mention of cohesive devices, just managing of cohesion.
They are useful at times but don’t depend on them too much.
Dear Sir,
We see three pies here, can I use graphs or charts in the first sentence? There is no time mentioned in the question, can I use the present tense in the report? “Turning to breakfast and snacks, which also had comparable percentages, they were both made up of 14% sodium. ” Is it OK to say …… they both made up 14% of the overall intake of sodium?
Thank you.
Nina
Hello!
They can be called charts or graphs. Present tense is fine if it does not show a time period. Yes, your last suggestion is fine.
Is that all clear, Nina?
Dear Dave,
Thank you for your reply. I really like your writing for both Task 1 and Task 2. Here the word “contained” is a little confusing to me as it seems to focus on the various ingredients of a certain meal rather than that meal’s share of the total fats consumption a day.
Thanks for your comment!
The charts show how much of those ingredients are in each type of meal, so saying that the meal contains a certain amount of those ingredients is just a way of flipping around that equation.
Does that make sense?
Thank you, Dave!
This really is not an easy task for me. It seems that I need more time to digest everything. Thank you for your help!
Nina
You’re welcome, Nina!
Hey Dave,
Can I use words like “over two fifths”, “almost one quarter”, “almost/over 20%” etc
Definitely!
can anyone check my writing im new to it
Post it here and I will give you some feedback, Jaismeen!
I think breakfast is the lowest percentage in 3 types of nutrients
Let me double check!
Can you analyze my writing?I wrote this one by my own.
The pie chart represents the day-to-day consumption of nutrients like sodium, saturated fat, and added sugar in meals and snacks for an average US person measured in percentage.
Overall, it can be noticed that for sodium and saturated fat the highest intake is during dinner and for the added sugar, snacks are the highest contributor.
It can be added that the dinner consists of 43% and 37% of sodium and saturated fat respectively while that for added sugar it is 20% less than that for the sodium(23%). Sugar being the most in the snacks makes up to 42%. The lowest consumption of sodium and saturated fat is for the snacks which are 14% and 21% respectively. The lunch consists of the most balanced amount of all the three which is 29%,26%and 19 % respectively.
Saturated fat and added sugar contribute the same for breakfast which can be noted to be 16% of the total amount.
Nice work, Shruti!
It needs to a be longer though – there are also some little mistakes with grammar, vocabulary, punctuation, tense, etc. – I think if you write more carefully you could get a high mark!
I don’t get why did you use past tense when the task doesn’t specify the time? As far as I know, we use present simple if we are not given any timeframe or specific years.
Other than that though I am a big fan of your blog. Thank you for sharing hundreds or maybe even thousands of dollars worth knowledge and information!
Typically you are right, Ye.
In this case it is fine though as it obviously records foods that were previously eaten.
To be on the safe side, you are right – it is better to use present simple if no time period is specified.
Thanks for the feedback!
Good
Ielts
Indian
Writing task 1
Thanks
But I guess there two problems: