This is an IELTS writing task 1 sample answer essay line graph about the demand for steel.
Don’t miss out on any of my exclusive PDF sample answers by signing up for my Patreon here or my online courses here and my writing corrections here.
IELTS Task 1 Essay: Line Graph (Steel)
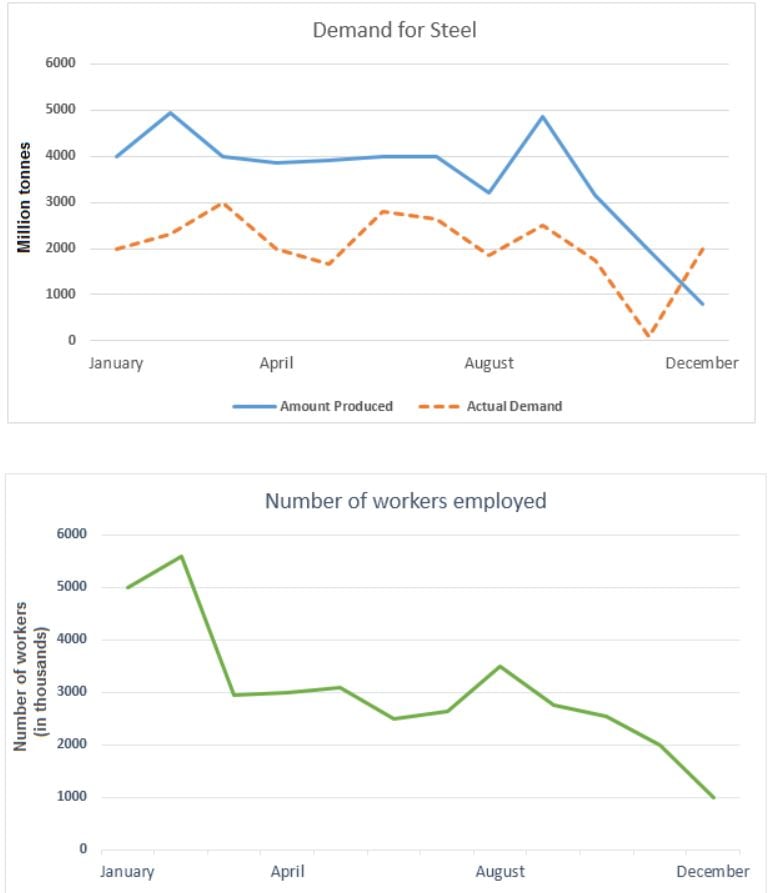
The line charts give information about the demand for steel and number of workers employed in a country from January to December.

The charts detail demand for steel and the number of workers employed in a given country over a one year period. Looking from an overall perspective, it is readily apparent that both demand and employment fluctuated but followed similar downwards trends. By the end of the period, actual demand had overtaken production.
In the first 2 months of the year, workers (6,000), steel production (5,000) and actual demand (3,000) peaked. From there, the number of workers fell steeply to 3,000 in March and was flat through April, while production dropped below 4,000 tonnes and remained stable to July. Actual demand also decreased, though it fluctuated between 2 and 3,000 tonnes through September, before plummeting to 0 in November and recovering to 2,000 in December.
This end of year pattern was largely mirrored by both production and employment as the former crashed from a second peak of nearly 5,000 in July to under 1,000 by the end of the period (with no recovery). Employment numbers rose to 3,500 in August and had steadily subsided to 1,000 by the end of the year.
Analysis
1. The charts detail demand for steel and the number of workers employed in a given country over a one year period. 2. Looking from an overall perspective, it is readily apparent that both demand and employment fluctuated but followed similar downwards trends. By the end of the period, actual demand had overtaken production.
- Paraphrase what the graph shows.
- Write a general overview including all categories and the fully trend.
- Aim for 2 sentences for your overview. Read more about overviews here.
1. In the first 2 months of the year, workers (6,000), steel production (5,000) and actual demand (3,000) peaked. 2. From there, the number of workers fell steeply to 3,000 in March and was flat through April, while production dropped below 4,000 tonnes and remained stable to July. 3. Actual demand also decreased, though it fluctuated between 2 and 3,000 tonnes through September, before plummeting to 0 in November and recovering to 2,000 in December.
- Begin to compare and describe the data.
- Group as much data as possible.
- Compare the different lines and incluse as much data as you can.
1. This end of year pattern was largely mirrored by both production and employment as the former crashed from a second peak of nearly 5,000 in July to under 1,000 by the end of the period (with no recovery). 2. Employment numbers rose to 3,500 in August and had steadily subsided to 1,000 by the end of the year.
- Make sure all areas are fully covered.
- And that the end points are clear.
Vocabulary
What do the words in bold below mean?
The charts detail demand for steel and the number of workers employed in a given country over a one year period. Looking from an overall perspective, it is readily apparent that both demand and employment fluctuated but followed similar downwards trends. By the end of the period, actual demand had overtaken production.
In the first 2 months of the year, workers (6,000), steel production (5,000) and actual demand (3,000) peaked. From there, the number of workers fell steeply to 3,000 in March and was flat through April, while production dropped below 4,000 tonnes and remained stable to July. Actual demand also decreased, though it fluctuated between 2 and 3,000 tonnes through September, before plummeting to 0 in November and recovering to 2,000 in December.
This end of year pattern was largely mirrored by both production and employment as the former crashed from a second peak of nearly 5,000 in July to under 1,000 by the end of the period (with no recovery). Employment numbers rose to 3,500 in August and had steadily subsided to 1,000 by the end of the year.
Answers
demand need
a given country a random nation
looking from an overall perspective, it is readily apparent that overall
followed similar downwards trends had almost the same pattern of decreasing
by the end of the period at the end
overtaken become greater than
in the first 2 months of the year January, February
peaked hit a high point
from there after that
fell steeply decreased a lot
flat stable
dropped below fell under
remained stable flat, no chance
through September to the end of September
plummeting decreasing a lot
recovering getting back to its previous point
pattern trend
largely mirrored mostly the same
former crashed one mentioned before fell a lot
no recovery did not get back to the same level
steadily subsided decreased steadily
Pronunciation
dɪˈmɑːnd
ə ˈgɪvn ˈkʌntri
ˈlʊkɪŋ frɒm ən ˈəʊvərɔːl pəˈspɛktɪv, ɪt ɪz ˈrɛdɪli əˈpærənt ðæt
ˈfɒləʊd ˈsɪmɪlə ˈdaʊnwədz trɛndz
baɪ ði ɛnd ɒv ðə ˈpɪərɪəd
ˌəʊvəˈteɪkən
ɪn ðə fɜːst 2 mʌnθs ɒv ðə jɪə
piːkt
frɒm ðeə
fɛl ˈstiːpli
flæt
drɒpt bɪˈləʊ
rɪˈmeɪnd ˈsteɪbl
θruː sɛpˈtɛmbə
ˈplʌmɪtɪŋ
rɪˈkʌvərɪŋ
ˈpætən
ˈlɑːʤli ˈmɪrəd
ˈfɔːmə kræʃt
nəʊ rɪˈkʌvəri
ˈstɛdɪli səbˈsaɪdɪd
Vocabulary Practice
Remember and fill in the blanks:
The charts detail d_________d for steel and the number of workers employed in a______________y over a one year period. L________________________________________________________t both demand and employment fluctuated but f_______________________________s. B____________________________d, actual demand had o_________________n production.
I________________________________r, workers (6,000), steel production (5,000) and actual demand (3,000) p_________d. F__________e, the number of workers f_____________y to 3,000 in March and was f____t through April, while production d__________________w 4,000 tonnes and r___________________e to July. Actual demand also decreased, though it fluctuated between 2 and 3,000 tonnes t_____________________r, before p_______________g to 0 in November and r______________g to 2,000 in December.
This end of year p___________n was l_________________d by both production and employment as the f__________________d from a second peak of nearly 5,000 in July to under 1,000 by the end of the period (with n_______________y). Employment numbers rose to 3,500 in August and had s_____________________d to 1,000 by the end of the year.
Listening Practice
If you’re interested, learn about the history of iron and steel below:
Reading Practice
Learn more about the production of steel below:
https://www.thebalance.com/steel-production-2340173
Speaking Practice
Answer the following questions from the real IELTS speaking exam:
Work
- Do you work or are you a student?
- What do you like about your work?
- What has changed at your work since you started?
- Do you like to work in the morning or afternoon?
Writing Practice
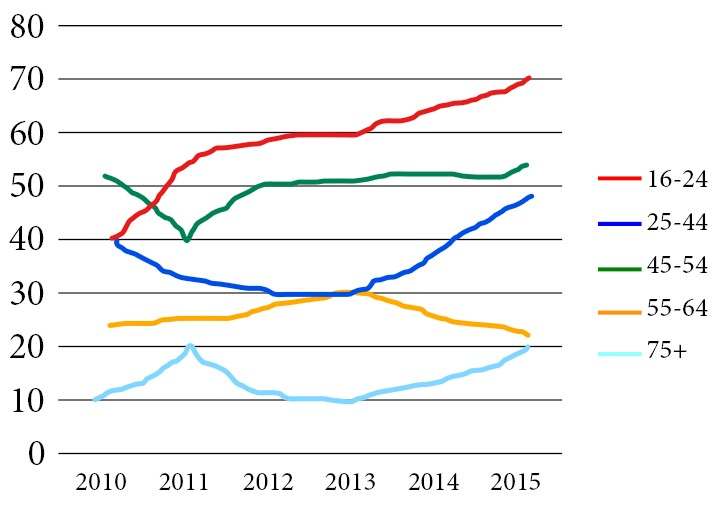
Write about the following graph showing the ages of people attending concerts in the UK then check with my sample answer below:


sir pls send pdf task 1 and 2 fully and if u have vocabularies pdf or folder share pls on our mail
This answer 149 words; would that fail the task completions and be a maxima of band 5.5?