This is an IELTS writing task 1 sample answer essay from IELTS Cambridge 15 on the topic of a line graph showing visitors to a Caribbean island.
Be sure that you check out my exclusive IELTS Ebooks and materials on Patreon here (and recommend a friend if you can!).
Writing Task 1 Tests 1-4:
Writing Task 2 Tests 1-4
IELTS Writing Task 2 Sample Answer Essay Cambridge 15: Owning or Renting a Home (IELTS Cambridge 15)
Dave
IELTS Writing Task 1 Sample Answer Essay IELTS Cambridge 15: Tourists Visiting a Caribbean Island
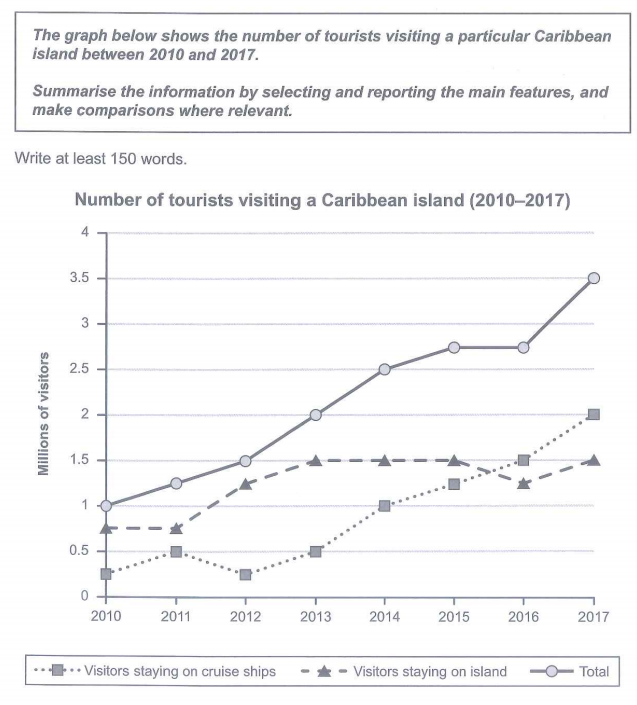
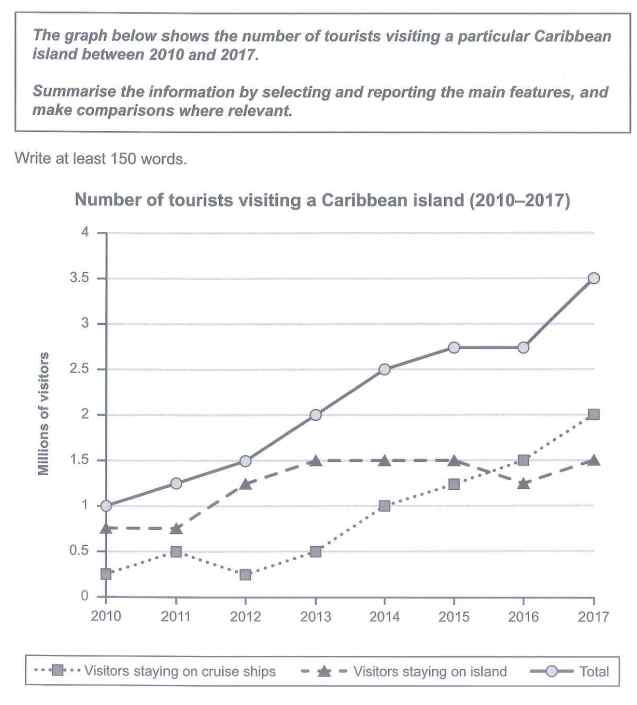
Summarise the information by selecting and reporting the main features, and make comparisons where relevant.
The line graph details the total number of tourists, as well as where they stayed, going to a given Caribbean island from 2010 to 2017. Overall, total tourists rose considerably, and those staying on cruise ships increased in particular, overtaking staying on the island itself, which underwent a more moderate increase.
Visitors residing on the island during their travels began the period at about .75 million, about 500,000 above those on cruise ships. From there, the numbers for the former climbed quickly to 1.5 million by 2013, a full million higher than the latter at the same time. Then those on the island were relatively steady until the end of the time surveyed, while cruise ship passengers rose steadily, surpassing the former figure midway through 2015 and reaching a peak in 2017 of 2 million.
The progressive patterns for visitors on cruise ships and the island were reflected in substantial gains for overall visitors, which started at 1 million in 2010, grew consistently to 2.7 million in 2015 before plateauing through 2016 and then increasing sharply to 3.5 million by the end of the period.
Analysis
1. The line graph details the total number of tourists, as well as where they stayed, going to a given Caribbean island from 2010 to 2017. 2. Overall, total tourists rose considerably, and those staying on cruise ships increased in particular, overtaking staying on the island itself, which underwent a more moderate increase.
- Paraphrase what the line chart shows.
- Write a general overview that describes the trend for all areas. Read more about overviews here.
1. Visitors residing on the island during their travels began the period at about .75 million, about 500,000 above those on cruise ships. 2. From there, the numbers for the former climbed quickly to 1.5 million by 2013, a full million higher than the latter at the same time. 3. Then those on the island were relatively steady until the end of the time surveyed, while cruise ship passengers rose steadily, surpassing the former figure midway through 2015 and reaching a peak in 2017 of 2 million.
- Begin to describe the data. Always compare.
- You don’t need all the data but focus on important changes/growth/falls.
- Follow both to the end of the period, comparing them throughout.
1. The progressive patterns for visitors on cruise ships and the island were reflected in substantial gains for overall visitors, which started at 1 million in 2010, grew consistently to 2.7 million in 2015 before plateauing through 2016 and then increasing sharply to 3.5 million by the end of the period.
- Don’t forget to write about the overall numbers as well!
Vocabulary
What do the words in bold below mean?
The line graph details the total number of tourists, as well as where they stayed, going to a given Caribbean island from 2010 to 2017. Overall, total tourists rose considerably, and those staying on cruise ships increased in particular, overtaking staying on the island itself, which underwent a more moderate increase.
Visitors residing on the island during their travels began the period at about .75 million, about 500,000 above those on cruise ships. From there, the numbers for the former climbed quickly to 1.5 million by 2013, a full million higher than the latter at the same time. Then those on the island were relatively steady until the end of the time surveyed, while cruise ship passengers rose steadily, surpassing the former figure midway through 2015 and reaching a peak in 2017 of 2 million.
The progressive patterns for visitors on cruise ships and the island were reflected in substantial gains for overall visitors, which started at 1 million in 2010, grew consistently to 2.7 million in 2015 before plateauing through 2016 and then increasing sharply to 3.5 million by the end of the period.
Answers
details illustrates
as well as and
given Caribbean island some island in the Caribbean such as Jamaice or Haiti
rose considerably increased a lot
staying on cruise ships remaining on luxury liner cruises
in particular especially
overtaking surpassing
underwent a more moderate increase experienced a smaller rise
residing living on
during their travels when they were travelling
former climbed quickly mentioned before area rose fast
higher than above
the latter the last mentioned one
at the same time in the same period of time
relatively steady generally level
end of the time surveyed by the end of the period
passengers people on cruise ships
surpassing overtaking
former figure number mentioned first
midway through halfway in
reaching a peak hit a high point
progressive patterns increasing trend
reflected mirrored, replicated
substantial gains big increases
grew consistently increased a lot
plateauing levelling off
increasing sharply rising a lot
Pronunciation
Listen and repeat:
ˈdiːteɪlz
æz wɛl æz
ˈgɪvn ˌkærɪˈbiːən ˈaɪlənd
rəʊz kənˈsɪdərəbli
ˈsteɪɪŋ ɒn kruːz ʃɪps
ɪn pəˈtɪkjʊlə
ˌəʊvəˈteɪkɪŋ
ˌʌndəˈwɛnt ə mɔː ˈmɒdərɪtˈɪnkriːs
rɪˈzaɪdɪŋ
ˈdjʊərɪŋ ðeə ˈtrævlz
ˈfɔːmə klaɪmd ˈkwɪkli
ˈhaɪə ðæn
ðə ˈlætə
æt ðə seɪm taɪm
ˈrɛlətɪvli ˈstɛdi
ɛnd ɒv ðə taɪm sɜːˈveɪd
ˈpæsɪnʤəz
sɜːˈpɑːsɪŋ
ˈfɔːmə ˈfɪgə
ˈmɪdˈweɪ θruː
ˈriːʧɪŋ ə piːk
prəʊˈgrɛsɪv ˈpætənz
rɪˈflɛktɪd
səbˈstænʃəl geɪnz
gruː kənˈsɪstəntli
ˈplætəʊɪŋ
ɪnˈkriːsɪŋ ˈʃɑːpli
Vocabulary Practice
Remember and fill in the blanks:
The line graph d________s the total number of tourists, a___________s where they stayed, going to a g__________________________d from 2010 to 2017. Overall, total tourists r____________________y, and those s__________________________s increased i____________________r, o__________________g staying on the island itself, which u______________________________________e.
Visitors r_____________g on the island d______________________s began the period at about .75 million, about 500,000 above those on cruise ships. From there, the numbers for the f___________________________y to 1.5 million by 2013, a full million h_____________n t_______________r a______________________e. Then those on the island were r____________________y until the e___________________________d, while cruise ship p_________________s rose steadily, s___________________g the f____________________e m__________________h 2015 and r____________________k in 2017 of 2 million.
The p______________________s for visitors on cruise ships and the island were r________________d in s___________________s for overall visitors, which started at 1 million in 2010, g_____________________y to 2.7 million in 2015 before p___________________g through 2016 and then i_____________________y to 3.5 million by the end of the period.
Listen and check:
Listening Practice
Learn about the world’s most expensive cruise ship below:
https://www.youtube.com/watch?v=x4NInkmpJWE
Reading Practice
Learn about Caribbean islands below in case you are planning on taking a holiday there!
Speaking Practice
Answer the following related questions from the real IELTS speaking exam:
Public Holidays
What public holidays do you celebrate in your country?
Which public holiday do you like the most?
What do you do during that holiday?
Do you think there should be more public holidays in your country?
IELTS Speaking Exam
Writing Practice
Answer the following related question and then check with my sample answer.
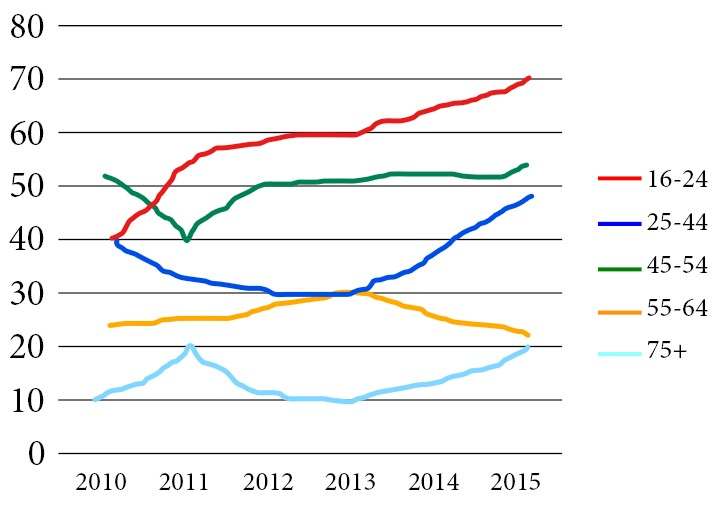
The graph below shows the percentage of people in different age groups in one city who attended music concerts between 2010 and 2015.


Hi Dave, Your website is a wonderful learning resource. Please comment on my writing and possible band score. Do you think it is any closer to band 7?
My problem is the word count which goes usually beyond 200 for task 1 and up to 350 for task 2. What should I do to limit it?
Many thanks for the great work!!!
The line graph compares the number of visitors to a certain Caribbean island for a 7-year period from 2010.
Overall, it is apparent that the total number of tourists visiting the island increased over the years. Also, the number of visitors staying on the island remained higher than the ones staying on the cruise ships for most of the duration except near the final years where the latter outnumbered the former.
It can be seen that the total number of visitors initially was exactly 1 million in 2010, increased exponentially for the next 2 years, then rose gradually till 2015 to reach almost 2.7 million and remained flat for a year. This number finally jumped dramatically to hit a peak of 3.5 million in 2017.
The visitors on the island and cruise ships were nearly 0.7 and 0.3 million respectively in 2010. Afterward, visitors on the island gradually increased till 2013 to reach a high of 1.5 million and remained stable till 2017 with a small dip in 2016. Cruise ships on the other hand, with mild fluctuations, kept increasing till mid-2015 to surpass the numbers on island visitors to hit a peak of 2 million in 2017.
Nice writing Faiza!
For the band score you can sign up here.
Your overview is great and you describe all the data. You are in the band 7+ category for sure.
good job
The line graph below demonstrates the number of tourists that visited a certain Caribbean island in the period from 2010 till 2017.
Overall, in 2010, the number of tourists spiked at 1 million visitors. That number had a steady increase till 2016 where it had experienced a noticeable increase in 2017 where the number of visitors reached 3.5 million which the highest the island had ever witnessed.
On one hand, almost three quarters of a million visitors stayed on cruise ships in 2010, the same number occurred in 2011. By 2012, the number has increased to reach 1.25 million and from 2013 till 2015 in remained stable at 1.5 million tourists. By 2016, a slight decrease was seen where the number of visitors was almost 1.25 million. However, by 2017, it has recovered to 1.5 million tourists.
On the other hand, the number of tourists was bouncing between 2010 and 2013 from 250,000 to 500,000 visitors. The number of tourists had seen a steady increase at the beginning of 2013 reaching, by 2017, 2 million tourists that decided to stay on the island.
Hello, i would absolutely appreciate if you could evaluate my summary, i would love to know if my grade is decent or do i need to practice more. Thank you Dave
It’s always good to get in more practice! What score are you aiming for?
Good attempt, Mohanad!
The overview has specific detail in it so that will not count as an overview and limit your score to band 5 for task achievement.
Also, some of your vocabulary is too informal.
Hi Dave, hope you are doing well. Thank you for this wonderful sample. My sample is below. Were do you think I should improve and what would be the possible band score for this answer?
The line graph illustrates the amount of visitors in millions received by a particular Caribbean island, further categorized into visitors staying on the island, staying on cruise ship and the total figure from the year 2010 to the year 2017.
From an overall perspective, it is readily apparent that the amount of visitors increased throughout the years on all three categories. Among them, most visitors preferred staying on cruise ships rather than on the island itself.
The preference of tourists on the basis of their stay, which is on the cruise and on the island, both, accounted for less than 2.5 million in the course of 8 years. At the start of the year, staying on island was highly popular as it was dominated by 0.75 millions of visitors which remained constant until 2011. The same pattern is again seen from 2013 to 2015 after it gradually increased up to 1.5 million from 2011 to 2013. Finally, in the end the figure remained same as it did from 2013 to 2015 after dropping slightly to 1.25 million. In terms of staying in the ships, the figures fluctuated from 2010 (0.25 million) to 2013 (0.5 million) before gradual multiplication to 2 million visitors.
The total number of visitors received by the island at the start of the year was 1 million which gradually rose up to 2.75 million in 2015. In 2016, the figure remained exactly same as it did in 2016 but surged and peaked 3.5 million in the final year.
Good overview, Sasha!
Work on articles, subordinate clauses and prepositions!
Hello Everyone,
Could you clarify this sentence:
‘the numbers for the former climbed quickly to 1.5 million by 2013’ – as we have by 2013, should not we use Past Perfect (had climbed)?
Both are acceptable there.
Past simple for a finished event in the past – or past perfect for an event before another in the past.
A glance at the line graph provided reveals striking similarities in increasing in the number of visitors who visiting a Caribbean island between 2010 and 2017.
It is evident that, both groups, visitors staying on cruise ship and staying on island and their sum of saw considerable growth during same period.
Increasing from approximately a quarter of million in 2010 to half a million in 2012 in visitors staying on cruise ship. Between 2011 and 2012 the number of visitors decreased from 0.5 millions to a quarter of a millions. There was a significant increase in visitors from 2012 onwards and peaked out at 2 millions visitors in 2017.
The visitors staying on island meanwhile, remained constant at three quarter of a millions from 2010 to 2011. In subsequent years the figure saw a steady growth from three quarter of a millions to 1.5 millions at 2015. Between 2015 and 2017 the number of visitors fluctuated around 1.25 millions and 1.5 millions of visitors .
The sum of two groups of visitors saw gradually growth from 1 millions of visitors in 2010 to 3.5 millions of visitors in 2017.
Good overall, Mohsen but there are some issues with formality, paragraphing and grammatical accuracy.
Keep working hard!
thx bro rly apreciate the way u write stuff here cuz i didnt know how to analyze anything in a writing test hehe (thx rly)
You’re very welcome!
oh and sorry if i suck at commenting
haha, no worries – keep it up!
Hello I’m from Nepal .Do I need to pay for evaluation?
Hi Sir, I would like you to comment on my writing and possible band score. Do you think it is any closer to band 7?
The chart illustrates the number of visitors traveling to a Caribbean island and having a stay on cruise ships or islands, from 2010 to 2017.
Overall, between these 7 years, the total number of tourists has been increased from 1 million in 2010 to almost 3.5 million in 2017. Over time most people preferred staying on cruise ships to staying on the island.
In detail, out of one million visitors in 2010 almost 0.7 million favored staying on the island than on a cruise. In the following year, total visitors on the island crossed one million and stay on cruise ships by visitors also increased slightly b 0.2 million, whereas stay on the island remained relatively stable. Between the years 2011 to 2016, the total number of visitors to the island increased significantly from 1.2 million people to almost 2.6 million, however, total visitors remained the same in 2015 and 2016. During this period people living on the island increased modestly till 2013, up to 1.5 million than plateaued for the next 2 years. However, it decreased by 0.2 million people in 2016. Stay on varied in these years (2011 to 2016), at first, it rose in 2011 and then fell in 2012 to 0.5 million people, but later on, kept on increasing considerably reaching 1.5 million visitors.
In 2017, tourists increased by one million compared to last year and people staying on a cruise also increased to 2 million, whereas, visitors living on the island rose slightly by almost 0.1 million people.
Just advice. You are not allowed to use any specific data in your overall
Good point!
hi Dave! i hope you are doing well. thank you for your sample answer for this task. i have a request. could you please check my answer? i just have an exam in a few days. it would be great if you helped me. are there any significant mistakes? what do you think my score will be ?
the provided illustration represents the data about the quantity of travellers who visited the Caribbean island between 2010 and 2017 years.
overall,what stands out from the graph is that in proportion the whole proportion of tourists who visited an island experienced a rapid increase during the given period. another striking point is that visitors staying in cruise ships saw a gradual increase ,while the proportion of ones who stayed on island fluctuated and reached a plateau at the end of the period.
it can be clearly observed that total proportion of tourists jumped from one million (2010) to a three and a half millions (2017). what regards visitors who stayed on ships,the quantity of these ones rose gradually from 2010 to 2011 reaching exactly half a million,but in 2012 experienced a significant decrease and stayed at above 500.000 visitors a year. from this point the amount of these particular tourists started to grow gradually and at the end of the given period reached accurately 2 millions visitors a year. the accurate progress cannot be seen when it comes to the travellers who stayed at island during their holiday,from 2010 to 2011 proportion of tourists did not change at all,but from the end of 2011 it started to rise dramatically and reached one and half a million of visitors totally in 2015. in 2016 the rate of those who stayed at island suddenly collapsed reaching the mark above 1.2 million,but in a year it reached a plateau and returned to the earlier proportion of visitors (1.5m)
Good work, Aziza!
There are some informal points and the overview is a little long.
Work on your fixed expressions and punctuation as well or you will be stuck in the band 6 range.
here is a little bit changed version)))
The provided illustration represents the data about the quantity of travelers who visited the Caribbean island between 2010 and 2017 years.
Overall, what stands out from the graph is that the whole proportion of tourists who visited an island experienced a rapid increase during the given period. Another striking point is that foreigners staying in cruise ships saw a gradual increase, while the scale of ones who stayed on islet fluctuated and reached a plateau at the end of the period.
It can be clearly observed that total proportion of tourists jumped from one million (2010) to a three and a half millions (2017). What regards visitors who stayed on ships, the quantity of these ones rose gradually from 2010 to 2011 reaching exactly half a million, but in 2012 experienced a significant decrease and stayed at above 500. 000 visitors a year. From this point the amount of these particular tourists started to grow gradually and at the end of the given period hit accurately 2 millions visitors a year. The accurate progress cannot be seen when it comes to the travelers who settled at island during their holiday, from 2010 to 2011 proportion of tourists did not change at all, but from the end of 2011 it started to rise dramatically and reached one and half a million of foreigners totally in 2015. In 2016 the rate of those who stayed at islet suddenly collapsed reaching the mark above 1. 2 million, but in a year it reached a plateau and returned to the earlier proportion of visitors (one and half million)
The line graph depicts visitors of a special Caribbean island from 2010 to 2017 in millions. Overall, all the given data have increasing trend over the 7 years period.
It can be seen that total tourists number, had been on the rise over the given years, ranging from 1 to 3.5 millions. The number experienced a slight increase in the first two years, and 2015. In the contrast, there were some steep ones in 2013, 2103 and 2017.
There were a group that stayed on cruise ships. Their number started at a 250 thousands, doubled one year later, being half in 2012. After the first swings, witnessed an upward trend, from 0.25 to 2 millions. On the other hand, the number of people who stayed on island remained unchanged at first and second year, and 2013 to 2015. A rise had be experienced in 2011 to 2013 and last year, where there was a decline in the 2016.
The Line chart depicts the number of people visiting a Caribbean island as well as where they stayed during 2010-2017.
Overall, Millions of visitors visit a specific Caribbean island and this chart goes up with time. Moreover, the number of people staying on the island increased while those on cruise fluctuated throughout the period.
Begin with the visitors residing on cruise ships increased throughout the period. It can be seen that stats were the same in 2010 and 2012 with only 0.25 million people staying on the island. Otherwise, tourists’ attraction toward staying on cruise ships increased with time and reached its highest level in 2017 with 2 million tourists.
On the other hand, Comparatively fewer visitors prefer to stay on the island. It began with 0.75 million in 2010 and ended up with 1.5 million in 2017. It remained at the same level of 1.5 million thrice in 2013, 2014, and 2015 and after a dip in 2016, it went back to 1.5 million marks.
Nice work, Awais!
Good overview and you’ve got all the data!
I wonder the score about this , anyone can tell me?plz…