This is an IELTS writing task 1 sample answer essay from IELTS Cambridge 15 on the topic of the work for Anthropology graduates.
It is a really, really tough one!
There is a ton of data and the overview is hard because of all the information and how difficult it is to group the information.
The length is a little long (200 words) but it is needed to detail all the data and have a complete overview.
Be sure that you check out my exclusive IELTS Ebooks and materials on Patreon here (and recommend a friend if you can!).
Writing Task 1 Tests 1-4:
Writing Task 2 Tests 1-4
IELTS Writing Task 2 Sample Answer Essay Cambridge 15: Owning or Renting a Home (IELTS Cambridge 15)
Dave
IELTS Writing Task 1 Sample Answer Essay IELTS Cambridge 15: Anthropology Graduates
Summarise the information by selecting and reporting the main features, and make comparisons where relevant.
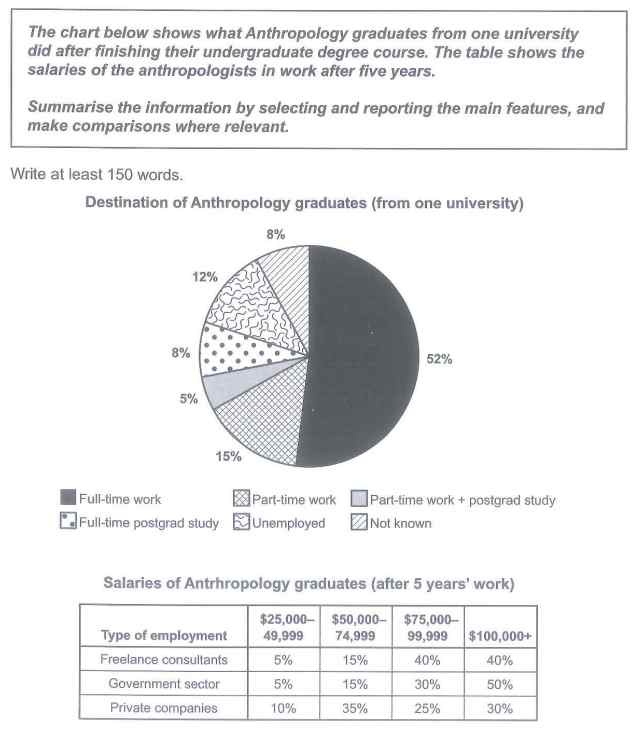
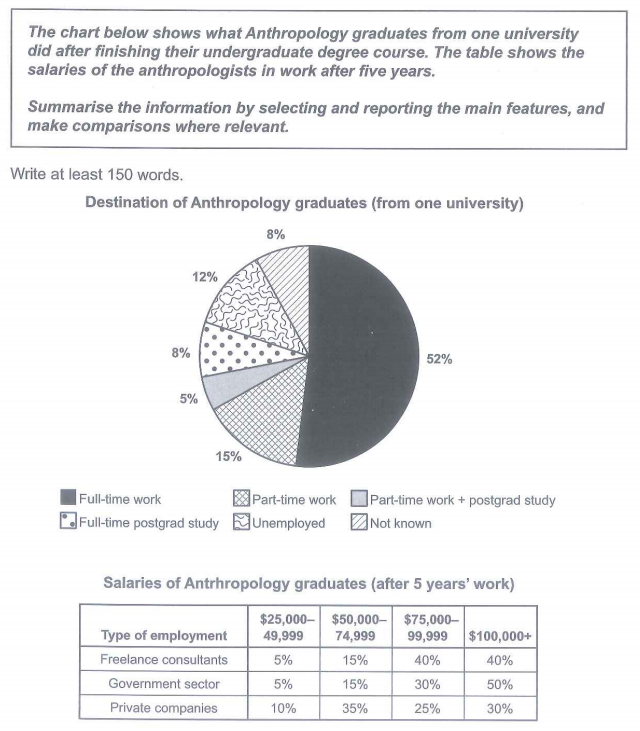
The pie chart details the initial occupations of Anthropology students after graduation and the table records their salaries following 5 years of work in various sectors. Overall, most graduates took full-time positions, followed by part-time jobs, unemployment, graduate study or unknown, and finally part-time work together with graduate study. The average salaries tended to be much higher for freelance consultants than those working in the government and private companies, though there were many federal workers in the highest salary bracket.
A total of 52% of graduates were employed full-time, compared to 15% for part-time, 12% unemployed, 8% categorised as unknown, 8% pursuing full-time further education, and finally 5% combining part-time work and higher education study.
Turning to the table, freelance consultants were overwhelmingly employed in the upper pay scales at 40% in both $75,000 – $99,999 and $100,000+, with just 20% making between $25,000 and $74,999. Government employees displayed a broadly similar pattern with identical figures at the two lowest pay bands, 30% in the $75,000 to $99,999 range, and 50% earning over a hundred thousand dollars a year. Private industry salaries diverged generally with 10% in the lowest income range, a striking 35% earning $50,000 to $74,999, while 25% and 30% of graduates made $75,000 – $99,999 and $100,000+, respectively.
Analysis
1. The pie chart details the initial occupations of Anthropology students after graduation and the table records their salaries following 5 years of work in various sectors. 2. Overall, most graduates took full-time positions, followed by part-time jobs, unemployment, graduate study or unknown, and finally part-time work together with graduate study. 3. The average salaries tended to be much higher for freelance consultants than those working in the government and private companies, though there were many federal workers in the highest salary bracket.
- Paraphrase what the graph and table are about – mention both.
- Your overview must cover all categories – that is why it is so long for this graph. Read more about writing a general overview here.
- Write an overview for the tables too. Read about the mistake that 99% of students make when writing overviews for tables here.
1. A total of 52% of graduates were employed full-time, compared to 15% for part-time, 12% unemployed, 8% categorised as unknown, 8% pursuing full-time further education, and finally 5% combining part-time work and higher education study.
- Give all the data for the pie chart.
1. Turning to the table, freelance consultants were overwhelmingly employed in the upper pay scales at 40% in both $75,000 – $99,999 and $100,000+, with just 20% making between $25,000 and $74,999. 2. Government employees displayed a broadly similar pattern with identical figures at the two lowest pay bands, 30% in the $75,000 to $99,999 range, and 50% earning over a hundred thousand dollars a year. 3. Private industry salaries diverged generally with 10% in the lowest income range, a striking 35% earning $50,000 to $74,999, while 25% and 30% of graduates made $75,000 – $99,999 and $100,000+, respectively.
- Begin to describe and compare the data for the table.
- Try to group the information as much as possible.
- Make sure that you cover all areas and all the data.
Vocabulary
What do the words in bold below mean?
The pie chart details the initial occupations of Anthropology students after graduation and the table records their salaries following 5 years of work in various sectors. Overall, most graduates took full-time positions, followed by part-time jobs, unemployment, graduate study or unknown, and finally part-time work together with graduate study. The average salaries tended to be much higher for freelance consultants than those working in the government and private companies, though there were many federal workers in the highest salary bracket.
A total of 52% of graduates were employed full-time, compared to 15% for part-time, 12% unemployed, 8% categorised as unknown, 8% pursuing full-time further education, and finally 5% combining part-time work and higher education study.
Turning to the table, freelance consultants were overwhelmingly employed in the upper pay scales at 40% in both $75,000 – $99,999 and $100,000+, with just 20% making between $25,000 and $74,999. Government employees displayed a broadly similar pattern with identical figures at the two lowest pay bands, 30% in the $75,000 to $99,999 range, and 50% earning over a hundred thousand dollars a year. Private industry salaries diverged generally with 10% in the lowest income range, a striking 35% earning $50,000 to $74,999, while 25% and 30% of graduates made $75,000 – $99,999 and $100,000+, respectively.
Answers
details illustrates
initial occupations first jobs
Anthropology the study of peoples, history, and culture
records details
following after
various sectors different areas
full-time positions 40 hour+ jobs
part-time jobs under 40 hours, hourly paid work
unemployment not having a job
graduate study learning for a masters or PhD
tended to be is usually
freelance consultants advisers
private companies commercial entities
federal related to the government
highest salary bracket those who made the most money
compared to in contrast to
categorised as in the group of
pursuing seeking
combining together
turning to the table looking at the table
overwhelmingly mostly
upper pay scales people who made more money
displayed showed
broadly similar pattern generally the same trend
identical figures same numbers
lowest pay bands least well paid
range grouping
earning making
private industry companies
diverged generally different overall
striking stands out
respectively in turn
Pronunciation
Listen and repeat:
ˈdiːteɪlz
ɪˈnɪʃəl ˌɒkjʊˈpeɪʃənz
ˌænθrəˈpɒləʤi
ˈrɛkɔːdz
ˈfɒləʊɪŋ
ˈveərɪəs ˈsɛktəz
fʊl-taɪm pəˈzɪʃənz
pɑːt-taɪm ʤɒbz
ˌʌnɪmˈplɔɪmənt
ˈgrædjʊət ˈstʌdi
ˈtɛndɪd tuː biː
ˈfriːˌlɑːns kənˈsʌltənts
ˈpraɪvɪt ˈkʌmpəniz
ˈfɛdərəl
ˈhaɪɪst ˈsæləri ˈbrækɪt
kəmˈpeəd tuː
ˈkætɪgəraɪzd æz
pəˈsjuːɪŋ
kəmˈbaɪnɪŋ
ˈtɜːnɪŋ tuː ðə ˈteɪbl
ˌəʊvəˈwɛlmɪŋli
ˈʌpə peɪ skeɪlz
dɪsˈpleɪd
ˈbrɔːdli ˈsɪmɪlə ˈpætən
aɪˈdɛntɪkəl ˈfɪgəz
ˈləʊɪst peɪ bændz
reɪnʤ
ˈɜːnɪŋ
ˈpraɪvɪt ˈɪndəstri
daɪˈvɜːʤd ˈʤɛnərəli
ˈstraɪkɪŋ
rɪsˈpɛktɪvli
Vocabulary Practice
Remember and fill in the blanks:
The pie chart d___________s the i______________________s of A_________________y students after graduation and the table r____________s their salaries f________________g 5 years of work in v_________________s. Overall, most graduates took f___________________s, followed by p______________________s, u___________________t, g____________________y or unknown, and finally part-time work together with graduate study. The average salaries t____________________e much higher for f__________________________s than those working in the government and p__________________________s, though there were many f_____________l workers in the h_________________________t.
A total of 52% of graduates were employed full-time, c_________________o 15% for part-time, 12% unemployed, 8% c__________________s unknown, 8% p_________________g full-time further education, and finally 5% c___________________g part-time work and higher education study.
T__________________________e, freelance consultants were o_____________________y employed in the u____________________s at 40% in both $75,000 – $99,999 and $100,000+, with just 20% making between $25,000 and $74,999. Government employees d______________d a b_________________________n with i___________________s at the two l________________________s, 30% in the $75,000 to $99,999 r__________e, and 50% e_____________g over a hundred thousand dollars a year. P____________________y salaries d______________________y with 10% in the lowest income range, a s______________g 35% earning $50,000 to $74,999, while 25% and 30% of graduates made $75,000 – $99,999 and $100,000+, r_________________________y.
Listen and check:
Listening Practice
Learn about anthropology below:
Reading Practice
Browse some recent, new discoveries in anthropology below:
https://www.livescience.com/topics/anthropology
Speaking Practice
Answer the following related questions from the real IELTS speaking exam:
History
Do you like reading books about history?
Which country’s history is most interesting to you?
Which historical event or period do you find most interesting?
Why is it important to read about history?
IELTS Speaking Exam
Writing Practice
Answer the following related question and then check with my sample answer:


The charts depict the whereabouts of Anthropology graduates in a single university & detail their salary rates after 5 years of working. Overall, the majority of graduates took full-time work, others chose part-time, full-time postgrad study, unemployment, and unknown, while a small portion opted to work part-time together with postgrad study. It can also be seen that after 5 years, regardless of the type of employment they were in, a large proportion of them was earning high salaries.
Just over half of Anthropology graduates worked full-time, and this proportion has a significant gap from the other destinations. This was followed by 15% for part-time, 12% for unemployed, 8% for both full-time postgrad study and unknown, and the lowest was 5% for part-time work along with postgrad study.
In terms of their salaries after 5 years, large percentages of freelance consultants, government sectors, and private companies were earning $100,000+, at 40%, 50%, and 30%, respectively. An average proportion of 40% for freelance consultants, 30% for government sectors, and 25% for private companies have a salary range of $75,000-99,999. Interestingly, percentages of 5% and 15% for both freelance consultants and governments sectors were just making $25,000-49,000 and $50,000-74,999, respectively. However, private companies collect more in these ranges, at 10% for the former and 35% for the latter.
Very well done!
Hi Dave! Thank you so much!
Do you think I can get 6.5 & above in my Task 1 writings?
I think you are right on the border and should tigthen up some areas with grammar to ensure you get that mark.
The pie chart below illustrates the course of life the Anthropology students from a certain university took after completing their undergraduate degree course. Moreover, the table demonstrates how much the earn monthly after five years.
Overall, the students who got full-time and part time work make up two-thirds of the Anthropology graduates. Furthermore, freelance consultants have a higher salary average compared to government and private companies employers.
Full time workers make up more than half of the graduates with 52%, followed by part-time and unemployed (15 and 12% respectively). Full time post graduates comprises 8% of the destination, the same with graduates with unknow destinations. Part-time work + postgraduates are the least of them all with 5%
Students that chose to be freelance consultants, in average, have a higher salary reaching up to 100,000$. Government sector employees have a similar percentage with the freelance consultants but more employees earn higher than 100,000$. Private companies workers earn the least out of the three where most of them earn between 50,000 and 74,999$ a month.
Can you please evaluate my summary, i need to know my level in writing
Hi Mohanad, you can sign up here: course.howtodoielts.com/band-scores-corrections
Good work Mohanad.
Be careful not to include specific data in your overview. Good accurate data but be careful with your level of formality and punctuation!
Why you have written average salary of freelancing is more than other. I am confused.
(5*2500 + 50000*15 + 75000*40 + 100000*40)/100 = 77625 (Average salary of free-lancing consultant)
(5*2500 + 50000*15 + 75000*30 + 100000*50)/100 = 80125 (Average salary of gov. sector)
I didn’t do the math out – it just struck me that there were more people in the two higher brackets though the average gets pulled up to favour the government employees due to the 50% making 100,000+. You wouldn’t be expected to make those kinds of calculations on the exam – good point though!
The given chart details the path which Anthropology students followed after finishing their undergraduate degree course at one university. The table illustrates the salaries of anthropology graduates after five years of work.
From an overall perspective, anthropology graduates from one university have found full-time work. Meanwhile, other students have to continue their studies or work part time. Salaries of graduates vary by type of employment.
More over half of anthropology graduates have obtained full-time work, a significant 52 percent. Students who desired to continue their education while working are in the minority, accounting for only 5% of the total. The percentage of full-time postgraduate students is 8%. However, part-time workers account for 15% of the workforce. Unemployed people account for nearly the same percentage of the population (12%). Finally, the group of unknown contains 8%.
Salaries of antrhropology graduates depend on their type of job. Freelance consultants have the biggest percent of 40, following the government sector by 30 percent. Salaries from 25,000 to 49,999 dollars, have an equal 5 percentage in freelance consultants and government sector. Meanwhile, private companies have an increased percent of 35.
The pie chart provides the information percentage-wise what the graduates of anthropology from one university chose to do after they completed their undergraduate degree and the table illustrates how much they got paid after five years.
Overall, it can be seen that most of the graduates involved in full-time work whereas least of them did part-time work together with postgraduate study. The average salaries tend to be much higher for freelance consultants in comparison to government and private companies.
To begin with, the highest percentage of graduates can be seen doing full-time work with 52%. In contrast, 5% of graduates did part-time work along with post-grad study. In addition, around 15% of students did the part-time job.
It also shows that 12% of graduates remained unemployed. Furthermore, 8% of graduates did full-time post-grad study and same was the case of graduates that was unknown.
Looking at the table, Anthropology graduates with the least salary range between 22000 and 49000 dollars were freelance consultants as well as government sectors at about 5% which was half the proportion of private companies. In contrast, graduates working as freelance consultants, in the government sector, and the private sector were considerably high at 40%, 50%, and 30% respectively.
It’s very helpful, Thank you Sir.
You’re welcome!
Don’t we need to write the conclusion? As there is no conclusion..can you please reply… I’m little bit confused
No conclusion needed for task 1, Sanjida!
Looking for feedback.
The given diagram and table provide information regarding job destinations and salaries after 5 years of work in different job sectors for anthropology graduates from a university.
Overall, we have contributions from full-time work, part-time, Part-time with post-graduation studies, full-time with higher studies, un-employed and some are unknown. It can be seen that more than 50 % of graduates are doing full-time jobs. The last contribution is from part-time with post-graduation study, which is 5%.
On the other hand, After 5 years of work, 40% of graduates working as freelancer consultants get higher salaries between 75,000-99,999 $.while 50% are earning more than $100,000. The private sector has the least number of Anthropologists with more than 100,000 $ in salary.
Most of the anthropology graduates are working in a full-time job, while part-time employees are 15% followed by unemployed with 12%. The unknown rate and those working full-time with their higher studies is 8%, while only 5% are working part-time with postgraduates studies.
The salary percentage after 5 years of work in both the Freelancer and government sectors is almost similar except for those earning between 75,000-99,999 $ and 100,000$. Freelancers have a higher percentage(40%) of anthropologists earning between 75,000-99,000$, while in government sectors 50% are earning more than 100,000$.
Private companies have a higher percentage of anthropologists earning from 25,000-49,000$ and 50,000-74,999$ which is 10% and 35 % respectively. While they have a comparatively low ratio of high salaried anthropologists ranges 25% and 30% with salaries between 75,000-99,000$ and 100,000$ respectively.
Nice Awais!
But you need an overview – the one you wrote doesn’t really count – you should try to rank them – as I do in my overview.
The data includes is good though there are lots of little punctuation mistakes.
Keep working hard!
looking for feedback.
The pie chart and table give information regarding job destinations and salaries after 5 years of work for anthropology graduates of a university.
Overall, we have contributions from full-time work, part-time, Part-time with post-graduation studies, full-time with higher studies, unemployed, and some unknown. It can be seen that more than 50 % of graduates did full-time jobs. The least contribution was from part-time with post-graduation study which was 5%.
On the other hand, After 5 years of work, 40% of graduates who worked as freelancer consultants got higher salaries between 75,000-99,999 $.while 50% were earning more than $100,000. The Private sector had the least number of Anthropologists with more than 100,000 $ in salary.
Most of the anthropology graduates were working in a full-time job, while part-time employees were 15% followed by unemployed with 12%. The unknown rate and those who worked full time with their higher studies was 8%, while only 5% did part-time jobs with postgraduates’ studies.
The salary percentage after 5 years of work in both the Freelancer and government sectors was almost similar except for those earning between 75,000-99,999 $ and 100,000$. The Freelancers had a higher percentage (40%) of anthropologists earning from 75,000$ to 99,000$, while in government sectors 50% earned more than 100,000$.
The Private companies had a higher percentage of anthropologists earning from 25,000-49,000$ and 50,000-74,999$ which was 10% and 35 % respectively. While they had a comparatively low ratio of high salaried anthropologists ranges 25% and 30% with salaries between 75,000-99,000$ and 100,000$ plus respectively.