
The Most Common Score (because of IELTS overviews)
Be sure to avoid the mistakes that most students make on writing by signing up for my exclusive IELTS Ebooks here on Patreon.
They should be getting a 6 overall (or higher) for Task 1 Writing. But their scores look like this:
Task Achievement: 5
Cohesion & Coherence: 6
Vocabulary: 6
Grammar: 6
Overall: 5.5
That person’s score should be a 6. But it’s not.
And the reason is because they made one minor mistake with their overview.
The band descriptors state:

Writing that does not have an overview at all gets 5.
Writing that does not have a clear overview also gets a 5.
There’s one minor mistake that makes a major difference and stops the vast majority of students every week from writing a clear overview.
The Minor Mistake
This happens with every type of graph (maybe 75% of the time) but almost 100% with tables.
Here’s a table:
The graph below shows the average number of cups of coffee drunk per minute per person in three countries in 2000 and 2010.
2000 |
2010 |
|
Nepal |
1.2 |
1.1 |
Vietnam |
4.2 |
4.2 |
Indonesia |
8.7 |
9.2 |
For their overview, 99% of students write:
People in Nepal drank the least coffee in both of the years while Indonesians drank the most.
Here’s another example:
The graph below shows the number of tourists (in thousands) visiting different attractions in the United States in 2004 and 2017.
2004 |
2017 |
|
The Grand Canyon |
110 |
108 |
Yellowstone National Park |
231 |
252 |
The Golden Gate Bridge |
301 |
234 |
Disneyland |
364 |
375 |
Trump Tower |
870 |
952 |
And another common overview:
Trump Tower had by far the highest total number of visitors in both years surveyed while the Grand Canyon accounted for the lowest number.
The problem with both these overviews is that they just mention the top and the bottom, the high and the low.
That is not an overview – it is only the two key areas.
Both of these students will get 5 for Task Achievement even if the rest of their writing is absolutely amazing.
That’s because the overview requires an overview of all the information.
It is not a summary.
It is not writing about the main factors.
It is like a bird flying over a field seeing everything. You must include everything in your overview or it doesn’t count as an overview.
Are all countries mentioned? Are all tourist attractions mentioned?
If not, it’s not an overview. Task Achievement = 5.
How to Fix the Mistake
What can you do to make sure that you include an overview of everything?
Think of your overview as two sentences, not one.
For the first graph:
The graph below shows the average number of cups of coffee drunk per minute per person in three countries in 2000 and 2010.
2000 |
2010 |
|
Nepal |
1.2 |
1.1 |
Vietnam |
4.2 |
4.2 |
Indonesia |
8.7 |
9.2 |
Band 5 Overview (just the high and low):
People in Nepal drank the least coffee in both of the years while Indonesians drank the most.
Band 6 Overview (all areas included):
People in Nepal drank the least coffee in both of the years while Indonesians drank the most. Vietnamese people occupied the middle position.
Band 7+ Overview (all areas included with more detail):
People in Nepal drank by far the least coffee in both of the years and there was a slight decline over the years while Indonesians drank considerably more than both other countries, including a small upward trend. Vietnamese people were almost directly in the middle in terms of coffee consumption and there was no change over the years.
You can still mention the top and the bottom as the main information.
Just include one more sentence so that you write about everything.
Same thing with the second graph:
The graph below shows the number of tourists (in thousands) visiting different attractions in the United States in 2004 and 2017.
2004 |
2017 |
|
The Grand Canyon |
110 |
108 |
Yellowstone National Park |
231 |
252 |
The Golden Gate Bridge |
301 |
234 |
Disneyland |
364 |
375 |
Trump Tower |
870 |
952 |
Band 5 Overview:
Trump Tower had by far the highest total number of visitors in both years surveyed while the Grand Canyon accounted for the lowest number.
Band 6 Overview:
Trump Tower had by far the highest total number of visitors in both years surveyed while the Grand Canyon accounted for the lowest number. The middle posititions were occupied by Yellowstone National Park, the Golden Gate Bridge and Disneyland.
Band 7+ Overview:
Trump Tower had by far the highest total number of visitors as well as the largest rise in both years surveyed while the Grand Canyon accounted for the lowest number and experienced a small drop off. Trump Tower’s popularity was followed distantly by three attractions with roughly similar numbers: Disneyland, Yellowstone National Park, and the Golden Gate Bridge (the only one of the three to also have a downward trend).
The extra sentence does all the extra work!
What You Should Do
When you get to the overview in your Task 1 Writing – slow down.
Open your eyes. Write your overview.
Then go back to the graph and tick all the areas to make sure that everything has been mentioned.
Once you have done this, you know you will get at least a 6 for Task Achievement and the score you deserve.
Check out some of my other sample answers for task 1 to see this in action!
Now it’s Your Turn!
Write an overview for the following table and post it in the comments below or on our Facebook Group:
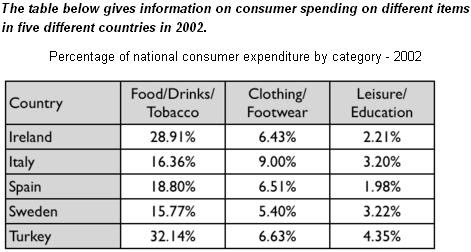


Overall, while people in five countries mentioned spent the most money on food, drink and tobacco, the least amount belonged to education and leisure activities. Clothing and footwear, slightly higher than education and leisure, were in the middle.
Great – you got all the important information in Hao!
Hy
There is a clear trend in 5 countries with most money being spent on Food/Drink and Tobacco, followed by clothing/footwear and Leisure/Education in descending order. Ireland and Turkey came out on top in spending for Tobacco/Food/Drink with figures almost double that in other countries. Italy ranked first in spending for Clothing/Footwear while Turkey topped others in Leisure/Education.
Great, Minh!
Overall,it is evident that consumers from all five countries spent the most on food, drinks and tobacco, with Ireland and Turkey being the lasrgest consumers. The least was spent on leisure and education, where as, clothing and footwear was directly in the middle.
Great! ‘Whereas’ is one word!
Overall , all five countries spent the most on food, drinks and tobacco, while spending on leisure and education was the least amongst the category studied. Clothing and footwear occupied the middle class of all spendings for the countries. Also, Turkey was noticed to be the highest consumer for the class of leisure and education, as well as food,drinks and tobacco,while italy were the major buyers of cloths and foot wears.in comparism the least purchase for food/drinks/tobacco), clothing/footwear was made buy sweden,spain on the other hand spent the lowest figure on education and leisure activities.
Great work! ‘the categories, occupied the middle positions for spending for, Turkey consumed the most in terms of, clothes, footwear’ – try to keep it to two sentences and not be so mechanical listing all the areas!
Thanks dave,
Here is my correction to avoid the mechanical listing
Overall , all five countries spent the most on food, drinks and tobacco with turkey and sweden been the highest and lowest consumers respectively. While, spending on leisure and education was the least amongst the category studied,surprisingly turkey was still the major part of the market in this class, spain on the other hand was the smallest participant. Clothing and footwear occupied the middle class of all spendings for the countries, with italy as the largest contributor and sweden as the lowest.
In 2002, Food, drinks, and tobacco is the category where consumers of five countries spent the most money on by far as well as Turkey and Ireland being the main consumers. Whereas the least category was spent on leisure and education, clothing and footwear occupied the middle position.
Keep it up! ‘food, was the, of the five, with Turkey and Ireland spending the most, least was spent on, middle positions.’
Are you sure..? Do we need to write down all the points made from the chart in the overview? Even though it is not a striking point? Does it seem to focus on so much details?
Yes, it is very tricky sometimes but an overview, by definition, should touch on every area. That is why you must find a way to group the information – otherwise, you will be too focused on detail as you said!
The table illustrates the percentage of consumer spending on different items among 5 countries in 2002. Overall, people in given countries tend to spend the largest on food, drink and tobacco while the percentage of expenditure on leisure and education by far is the least. Spending on food/drink/tobacco is followed distantly by clothing/footwear, which shows larger, but not significantly, percentage than leisure/education.
Grea work! ‘The table illustrates the percentage of consumer spending on different items among 5 countries in 2002. Overall, people in the given countries tend to spend the most on food, drink and tobacco while the percentage of expenditure on leisure and education is by far the least. Spending on food/drink/tobacco is followed distantly by clothing/footwear, which shows larger, but not significantly, percentages than leisure/education.
Didn’t even notice those mistakes.Thanks a lot
You’re welcome!
How about so much information is indicated? It seems that I can not add all information in overview. IELTS official YouTube (British council) said you should not put all information and should pick up the features. I’m confused so please tell me.
An overview should touch on everything but not in detail, nothing specific. Sometimes this is easy (usually with line graphs). With tables try to find a way to group and describe all the changes. Do the categories go up or down? Is it dominated by one category and the others are much lower? Look to group and describe what happens. The only way to do it, is to practice with tons and tons until you feel confident. Practice your overviews more than anything else!
The given chart describes carefully the trend of consumption on different products for five countries in 2002. It can be clearly noticed that the majority of money was spent in food/drinks/tobacco in all the five countries while considering clothing and footwear less important with leisure /education being the least consumed by all consumers. Interestingly enough Italy has spent a great amount of money in clothing/footwear compared to the other four countries. One the other hand Turkish people consider leisure /education the most important to spend their money on.
Good work!
Here is some corrections:
The given chart describes the trend of consumption on different products for five countries in 2002. It can be clearly seen that the majority of money was spent in food/drinks/tobacco in all the five countries with clothing and footwear less important with leisure/education being the least consumed by all consumers. Italy spent a great amount of money in clothing/footwear compared to the other four countries. One the other hand Turkish people consider leisure /education the most important to spend their money on.
Just be careful of opinion!
Thank you so much for taking your time to reply! And thank you indeed for your great job with this website. Extremely useful.
You’re welcome – keep up the hard work!
A considerable proportion of family budget in all the above countries went to food, drinks and tobacco, which is distantly followed by the category of clothing and footwear. However, leisure and education accounted for the minimum percentages of spending in all areas.
Well written!
Overall, food/drinks/tobacco were significantly more common than clothing/footwear and leisure/education. Turkey lavished the most except in the clothing/footwear category, which was overtaken by Italy. Only a minority of Sweden’s expenditures are placed on these sectors, except in leisure/education, which it was the second in spending.
Very well written William!
Overall, Turkey spent most money on food/drinks/tobacco, followed by Ireland, Spain, Italy and Sweden. In terms of consumer spending on clothing and footwear Italy’s rate was far high, while other countries accounted almost the same percentage. Also, proportion of expenditure on leisure/education was highest in Turkey, middle and almost the same in Italy and Sweden, and the least in Spain and Ireland.
Very good! Almost too detailed but you covered all areas so it is a band 7+ overview – keep it up and do practice with some more table, Doston!
provided table illustrates how different items have been consumed by customers in five countires in 2002. Overall it can be seen that, food and tobacco experienced the most popular expenditure, while clothing was also popular and lesuire and education was generally less common. However, Turkish and Ireland people spent more money on food and tobacco.
Good work Uma!
The chart details the expenditure proportions of five countries on three distinct features. It is readily apparent that all countries spent the highest amount of money on foods, drinks, and tobacco, whereas their lowest expenditures were on leisure and education with clothing and footwear receiving the moderate spending.
Great, Rizki!
Overall, the highest expenditure was on food/drinks/tobacco in Turkey, followed by Ireland, while the lowest was on leisure/education, with Spain scoring the least percentage. Figures for Italy and Sweden were close, except for clothing/footwear, where Italy featured a higher percentage.
Nice – really accurate and clear Elmasry!
Five different countries namely; Ireland, Italy, Spain, Sweden and Turkey have been surveyed for their three different category of expenditures. While the highest amount of expenditures in all surveyed countries belongs to Food, Drinks and Tobacco category, Leisure and Education holds the lowest amount of spending. Distantly after Food and drinks and Tobacco comes clothing and Footwear which have relatively higher amount of expenditure than that of Leisure and Education.
Good though you don’t have to capitalise those categories as they are not proper nouns, Behi!
Given is a table representing the rate of money spending on different demands of five nations in 2020. Looking from an overall perspective, Food/Drinks/ Tobacco obviously is the leading sector of all with both Turkey and Ireland standing at the top and the rest are approximately similar. The remain sectors (Clothing/Footwear and Leisure/Education) follow distantly with all countries data are closely equal except for Italy and Turkey surpass others in Clothing/Footwear and Leisure/Education respectively.
Well written, Felix – a bit long but better to be safe than sorry with the overview.
Thanks Dave, I didn’t think you would reply this comment as it’s been years since you post this lesson! There’s no doubt that this is the best website that I have ever found!
Haha, thanks Felix!
Overall, it is clearly apparent that food, drinks and tobacco were the most popular items consumed by the majority of people in five regions compared to other goods and/or services. While Turkey led the expenditure numbers of food/drink/tobacco and leisure/education, the Italians were considerably accounted for the larger number for spending on clothing and footwear than any other countries.
Great Zahra!
You touched on all areas and picked out the highs – perfect!
The given table illustrates information on the amount spent on various items in 2002 across five nations. Units are measured in percentages.
Overall, it is evident that, the highest proportion of the budget was spent on food/drinks/tabaaco, followed by clothing/footwear and the least was on leisure/Education. Turkey spent the most regarding food/drinks/tobacco and leisure/Education followed by Ireland in terms of food/drinks/tobacco. Italians spent most of their budget on clothing/footwear while Spain and Sweden spent the lowest in the three categories aside food/drinks/tobacco consumption in Spain which was slightly above Italy.
Good work, Agyemang!
It is a little long for an overview though – try to keep it to 2 shorter sentences if possible.
Thank you Dave! This post really helpful to me.
You’re welcome!
Overall, it is indicated by the table that all of the 5 countries have spent most of the expenditures on food, drinks, and tobacco, while they use the least money on leisure and education. Moreover, the clothing and footwear category is in the middle position of national consumer spending.
Great work and detail, Wuto!
The table depicts the spending rates of consumers from 5 countries on three different purposes in 2002. From an overall perspective, in 2002, people in 5 countries spent mostly on food, drink and tobacco in which Ireland and Turkey had the greatest spending, while people in Spain spent the least on leisure and education compared to the remaining countries. Italy accounted for the biggest spending on clothing and footwear whereas Sweden had the smallest figure.
The Irish and the Turkish spent on food, drinks and Tobacco by far higher than the other three, rating at 28.91% and 32.14% respectively, following by Spain (18.8%), Italy (16.36%) and eventually Sweden (15.77%). Concerning clothing and footwear, the most spending appeared in Italy, which accounted for 9%. Three other countries are Ireland, Spain and Turkey had relatively similar rates, at 6.43%, 6.51% and 6.63%, respectively, while people in Sweden spent merely for 5.4%.
Regarding the spending on leisure and educational activities, the smallest figure being 1.98% was witnessed in Spain, following by 2.21% of Ireland, 3.2% of Italy, 3.22% of Sweden and the highest was 4.35% in Turkey.
The given table illustrates the percentage of expenses on difterent items by the people of various nations in 2002. Looking from an overall prespective, it is readily apparent that the people spent mostly in food/drinks/tobacco followded by Clothing/footwear and leisure/education. Turkey had the highest percentage of food/drinks/tobacco consumption whereas, Ireland was accounted at second along with other three countries which had the similar results with Sweden being the least. However, Italy had the highest figure in terms of the clothing/footwear; Ireland, spain and turkey had the similar results; Sweden was the lowest in percentage. Furthermore, percentage of spending on Leisure/Eductation was higher in Turkey whereas, Spain was the lowest in education.
Overall, in all the nations most spending were on food/drink and tobacco whilst leisure and education were the field where the spending was least. Spending in chothes and footwear comes in middle which was slightly higher as compare to leisure and education’s spending
Overall, the major spending was, by far, on food/drinks/tobacco in all countries while leisure/education was the least spent on. Turkey spent the most on food and leisure/education categories whereas Sweden’s spent the least among the five countries, for consumables and clothing. Ireland, Italy and Spain had varying contributions to the three categories.
overall, all given countries spending highest on food products among this Turkey was the highest followed by Ireland; the least recipient category was leisure in this Italy and Span, spending respectively in equal proportions, the middle category of clothing and footwear Italy top in this all result receive same average amounts,
Looking from an overview perspective, it is readily apparent that Food, Drink, and Tobacco had by far the highest total proportion of consumers while leisure and education accounted for the lowest percentage in all five countries.