This is an IELTS writing task 2 sample answer essay on the topic of vehicles registered in Australia in 2010, 2012, and 2014 from the real IELTS exam/test.
The overview for this one is very simple because they already give you the general trends but there is still one tricky area that many students may forget about.
Read my answer below to find out the tricky part of the overview.
Please consider signing up for my Patreon here in order to support my efforts and receive exclusive Ebooks and materials related to IELTS!
Learn more about supporting my exclusive essays on Patreon here too.
Dave
Before reading, listen to the audio and make notes:
IELTS Writing Task 1 Sample Answer Essay: Vehicles in Australia Table (Real Past IELTS Exam/Test)
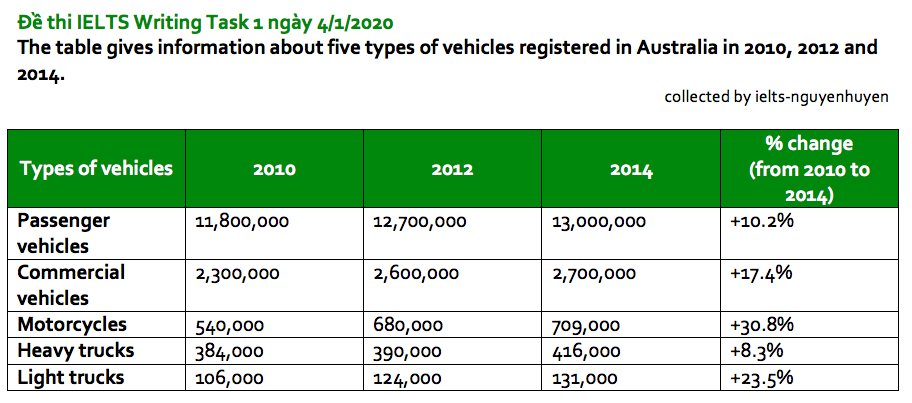
The table gives an account of the kinds of vehicles registered in Australia in 2010, 2012, and 2014. Registrations for all vehicles increased, though the growth in motorcycles and light trucks stands out most. Despite a smaller percentile increase, the totals for passenger vehicles were by far the highest and light trucks were lowest.
Passenger and commercial vehicles led total registrations throughout with the former beginning at 11.8 million in 2010 before rising by .9 million and .3 million, for a 10.2% overall jump. The latter underwent a 17.4% climb, going from 2.3 million to 2.6 million and finally 2.7 million by 2014.
The 3 remaining types of vehicles were considerably less common. The respective starting points for each were 540,000 motorcycles, 384,000 heavy trucks and 106,000 light trucks. Motorcycles rose the most rapidly, with a more than 30% increase to 709,000 by the end of the period. Heavy trucks made marginal gains totaling 8.3%, which amounted to 416,00 registrations in 2014. Finally, 124,000 new light trucks were registered in 2012 and an additional 131,000 in 2014 (translating to a 23.5% increase).
Word Count: 170
Analysis
1. The table gives an account of the kinds of vehicles registered in Australia in 2010, 2012, and 2014. 2. Registrations for all vehicles increased, though the growth in motorcycles and light trucks stands out most. 3. Despite a smaller percentile increase, the totals for passenger vehicles were by far the highest and light trucks were lowest.
- Paraphrase what the table shows.
- Include the trend for all areas – do they go up, down or stay the same? You can also highlight if one increased a lot, as I did with light trucks.
- To get full marks for your overview, also include the overall rankings. Even though light trucks increased the most, it was lowest overall while passenger vehicles was by far the highest.
1. Passenger and commercial vehicles led total registrations throughout with the former beginning at 11.8 million in 2010 before rising by .9 million and .3 million, for a 10.2% overall jump. 2. The latter underwent a 17.4% climb, going from 2.3 million to 2.6 million and finally 2.7 million by 2014.
- Begin describing the data. Try to group together the highest and lowest categories.
- Finish describing and comparing the data for those categories.
1. The 3 remaining types of vehicles were considerably less common. 2. The respective starting points for each were 540,000 motorcycles, 384,000 heavy trucks and 106,000 light trucks. 3. Motorcycles rose the most rapidly, with a more than 30% increase to 709,000 by the end of the period. 4. Heavy trucks made marginal gains totaling 8.3%, which amounted to 416,00 registrations in 2014. 5. Finally, 124,000 new light trucks were registered in 2012 and an additional 131,000 in 2014 (translating to a 23.5% increase).
- Compare the lower categories.
- Here I list the starting point for all the kinds of vehicles.
- Now I describe how one of them changed – make sure you include all the data!
- I next write about heavy trucks. Try to vary up your grammar and vocbulary.
- I finish with the last are. You do not need a conclusion!
Vocabulary
What do the words in bold below mean?
The table gives an account of the kinds of vehicles registered in Australia in 2010, 2012, and 2014. Registrations for all vehicles increased, though the growth in motorcycles and light trucks stands out most. Despite a smaller percentile increase, the totals for passenger vehicles were by far the highest and light trucks were lowest.
Passenger and commercial vehicles led total registrations throughout with the former beginning at 11.8 million in 2010 before rising by .9 million and .3 million, for a 10.2% overall jump. The latter underwent a 17.4% climb, going from 2.3 million to 2.6 million and finally 2.7 million by 2014.
The 3 remaining types of vehicles were considerably less common. The respective starting points for each were 540,000 motorcycles, 384,000 heavy trucks and 106,000 light trucks. Motorcycles rose the most rapidly, with a more than 30% increase to 709,000 by the end of the period. Heavy trucks made marginal gains totaling 8.3%, which amounted to 416,00 registrations in 2014. Finally, 124,000 new light trucks were registered in 2012 and an additional 131,000 in 2014 (translating to a 23.5% increase).
Answers
gives an account of illustrates
registrations people reporting their vehicles to the authorities
growth increase
stands out most most striking
smaller percentile increase increased in proportion less
led was first
throughout all during
former mentioned first
jump increase
underwent experienced
climb increase
remaining left over
considerably less common much less popular
respective starting points where each began
most rapidly very fast
by the end of the period at the end of the time surveyed
marginal gains totaling just small increases adding up to
amounted to totaling
additional extra
translating to meaning/equaling
Pronunciation
gɪvz ən əˈkaʊnt ɒv
ˌrɛʤɪsˈtreɪʃənz
grəʊθ
stændz aʊt məʊst
ˈsmɔːlə pəˈsɛntaɪl ˈɪnkriːs
lɛd
θru(ː)ˈaʊt
ˈfɔːmə
ʤʌmp
ˌʌndəˈwɛnt
klaɪm
rɪˈmeɪnɪŋ
kənˈsɪdərəbli lɛs ˈkɒmən
rɪsˈpɛktɪv ˈstɑːtɪŋ pɔɪnts
məʊst ˈræpɪdli
baɪ ði ɛnd ɒv ðə ˈpɪərɪəd
ˈmɑːʤɪnəl geɪnz ˈtəʊtlɪŋ
əˈmaʊntɪd tuː
əˈdɪʃənl
trænsˈleɪtɪŋ tuː
Listen and repeat:
Vocabulary Practice
Remember and fill in the blanks:
The table g___________________f the kinds of vehicles registered in Australia in 2010, 2012, and 2014. R_____________s for all vehicles increased, though the g______h in motorcycles and light trucks s____________________t. Despite a s_____________________________e, the totals for passenger vehicles were by far the highest and light trucks were lowest.
Passenger and commercial vehicles l__d total registrations t__________t with the f________r beginning at 11.8 million in 2010 before rising by .9 million and .3 million, for a 10.2% overall j____p. The latter u__________t a 17.4% c______b, going from 2.3 million to 2.6 million and finally 2.7 million by 2014.
The 3 r______________g types of vehicles were c________________________n. The r_____________________________s for each were 540,000 motorcycles, 384,000 heavy trucks and 106,000 light trucks. Motorcycles rose the m_____________y, with a more than 30% increase to 709,000 b_______________________d. Heavy trucks made m_________________________g 8.3%, which a______________o 416,00 registrations in 2014. Finally, 124,000 new light trucks were registered in 2012 and an a____________l 131,000 in 2014 (t______________o a 23.5% increase).
Listen and check:
Speaking Practice
Answer the questions below about public transportation from the real IELTS speaking exam:
Driving
- Do you like driving?
- Where was the last place you drove?
- Where do you like to sit in a car?
- Is driving common in your country?
Writing Practice
Write about the table below then check my sample answer:


Hi Dave, kindly shed some light on the essay below.
The table compares the number of registrations of five different types of vehicles in Australia over the period of 4 years.
In each of these years, passenger vehicles were the most popular means of transport. Additionally, there was a marked increase in all types of vehicles, particularly motorcycles.
Between 2010 and 2014, the number of registrations of passenger vehicles rose slightly from nearly 12 million to 13 million. Similarly, heavy trucks also saw a small rise in the number of registrations, starting from 384,000 in 2010 and reaching 416,000 by 2014.
A massive increase in the number of motorcycles was seen over the same period, with a jump of over 30% in just 4 years. At the same time, there was also a rapid growth of 23.5% in the number of light trucks registered, from 106,000 in 2010 to 131,000 in 2014. Finally, 2.3 million commercial vehicles were registered in 2010, and this figure had risen by over 17% by 2014.
(156 words)
Appreciate your help.
Bryan.
Well done!
a period… good overview… good comparison of data too… a rapid growth equating to 23.5%… with this figure having risen
There are hardly any mistakes at all but I think it could sound slightly more natural with more ellipsis (take out ‘and this figure had risen be over’ and change to ‘rising to’).
Morning, Dave.
The way I structured the essay above was that I divided body paragraphs based on CHANGES OVER TIME.
As you can probably guess:
+ 1st body = small changes
+ 2nd body = dramatic and bigger changes.
What if this time I do it this way?
+ 1st body = describe + compare DATA/FIGURE for the 1ST YEAR (2010) ONLY
+ 2nd body = describe + compare CHANGES over the next following years (by 2014)
Does this way affect band score?
Many thanks, Dave.
Have a great day!
Hi Bryan,
That structure is logical and good!
There isn’t one set structure so that won’t hurt your score at all.
It could be structured many ways and yours is as good as any.
The only mistake to avoid is not structuring it at all and just listing the data – that will hurt your cohesion/coherence and task achievement scores.
Yes, Dave.
You went to great lengths clearing it up for me.
Really appreciate that.
No problem – I’m sure it will help many students!
The table compares changes in the number of passenger vehicles, commercial vehicles, motorcycles, heavy trucks, and light trucks, in Australia in three different years (200, 2012, and 2014).
Overall, the figure for all types of vehicles witnessed upward trends, with the highest growth in the percentage of motorcycles and the lowest of heavy trucks. Besides, there were by far greater number of passenger vehicles than the other types of transportation combined, whereas light trucks accounted for the fewest number over the period shown.
In terms of passenger and commercial vehicles, in 2010, there were 11.8 million and 2.3 million vehicles respectively. After that, by 2014, there had been further growth to finish at 13 million passenger vehicles compared to 2.7 million commercial vehicles. These upward trends by 10.2% and 17.4% respectively made passenger vehicles the most common, and commercial vehicles the second most used type of transportation.
Turning to the remaining forms of transport, there were only 540 thousand motorcycles, 384 thousand heavy trucks, and 106 thousand light trucks in the first year. Four years later, the proportion of motorcycles rose by 31%, which was enough to make it the third most common private transport means, with 709 thousand motorcycles. Finally, in 2014, the figure for heavy and light trucks rose by 8.3% to 416 and by 23.5% to 131 thousand respectively.
Good work Saad!
Your overview is great, you compare the data well, you include all data and it is accurate – keep it up!
I would write 131,000 instead of 131 thousand – it is a more common convention.
Noted. Thanks bro.
No problem!
The given table provides information about registered vehicles in Australia in five different classifications in the years 2010, 2012, and 2014. Looking from the overall perspective, it is clear that the number of registered vehicles increased over the given period. Other striking features are the biggest percentage growth in motorcycles while heavy trucks recorded the smallest change.
As shown above, registrations for passenger vehicles had the highest numbers, started at 11.8 million in 2010, 12.7 million in 2012, and an increase of 300,00 by 2014. This was followed by commercial vehicles, from 2.3 million to 2.6 million, before rising to 2.7 million in 2014. The percentages jumped to 10.2% for the former and 17.4% for the latter.
Of the 5 types of vehicles in Australia, motorcycles, heavy trucks, and light trucks registered fewer units in the 4-year period. In 2010, registered vehicles were just 540,000 for motorcycles, 384,000 for heavy trucks, and 106,000 for light trucks. By 2014, although there were noticeable percentage increase, at 30.8%, 8.3%, and 23.5%, respectively, the ranking of these vehicles concerning the registration remained steady.
Well written Jessica!
Good overview – fully covered the trend and some ranking.
Really good comparison in the last paragraph.
Keep it up!
The table details five types of registered vehicles at two-year intervals between 2010 and 2014. Overall, it is readily apparent that although passenger vehicles were recorded highest throughout, registered motorcycles had the highest percentage change whereas the least change was seen in registered heavy trucks. Furthermore, commercial vehicles were seen second in the lead while light trucks had the least overall registration, albeit its second-rank in the percentage of change.
Passenger vehicles were recorded at highest throughout all years at 11.8 million,12.7 million, 13 million in 2010, 2012, and 2014 respectively. However, its percentage change was seen at a 10.2% increase which was one-third less than motorcycles at an increase of 30.8%. There was a consistent increase in registration of motorcycles from 540,000 in 2010, to an upsurge of 680,000 in two years and ended at 709,000.
In contrast, the least overall registered vehicles were recorded by light trucks at 106,000 (2010), a slight increase to 124,000 (in 2012), and gradual growth to 131,000 (2014). Despite considerable growth in registration of high trucks from 384,00 to 390,000 in 2012 before an increase to 416,000 at the end of the period, only 8.6% of increase was seen. Though commercial vehicles, on the other hand, saw a steady growth standing at 2.3 million, an increase by 0.3 million, and ended at 2.3 million, it had a high growth of 17.4%.