
This is an IELTS Writing Task 2 sample answer essay from the real exam on the topic of kiwi fruit exports from New Zealand to various other countries.
Table are usually the hardest to write about because the information is really hard to group together.
Read more about how to write overviews for tables here and how to write about IELTS tables in general here.
Be sure to check out my Patreon exclusive essays as well.
Dave
Before reading my answer, practice by listening to the audio and trying to write down all the data in the table on a piece of paper:
IELTS Writing Task 1 Sample Answer Essay: Table Kiwi Exports (Real Past IELTS Tests/Exams)
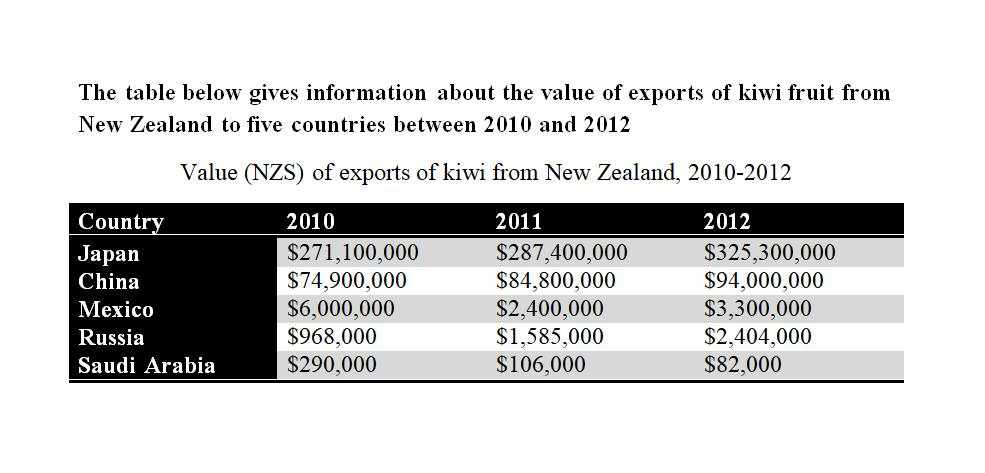
The given table organises the export value of Kiwis sent from New Zealand to five other countries in 2010, 2011, and 2012. The most striking feature of the graph is the overall numbers for Japan, which increased the most and were highest overall by far. Both China and Russia increased their imports and were second and fourth, respectively, while Mexico and Saudi Arabia’s export value declined, with Saudi Arabia importing the least by a significant margin.
Looking first at the countries that increased, Japan led the way going from $271,100,000 in 2010 to $287,400,000 before a surge to $325,300,000 by the end of the period. China showed a similar growth pattern increasing by approximately $10,000,000 a year to end at $94,000,000. Russia imported less, starting under a million at $968,000, nearly doubling to $1,585,000 and importing $2,494,000 worth of Kiwis by 2012.
In contrast, Mexican imports stood at $6,000,000 before falling by more than half to $2,400,000, and then recovering slightly to $3,300,000. Saudia Arabia fell more steadily ($290,000 to $106,000 and finally $82,000).
Word Count: 174
Analysis
1. The given table organises the export value of Kiwis sent from New Zealand to five other countries in 2010, 2011, and 2012. 2. The most striking feature of the graph is the overall numbers for Japan, which increased the most and were highest overall by far. 3. Both China and Russia increased their imports and were second and fourth, respectively, while Mexico and Saudi Arabia’s export value declined, with Saudi Arabia importing the least by a significant margin.
- Paraphrase what the graph shows for your first sentence – write it short and simple!
- For a table, pick out the biggest area/areas and say whether or not they increased/decreased and if they were the highest overall.
- Include all categories in your overview – did they increase or decrease? That is most important. Read more about the mistake 99% of students make with overviews for tables here.
1. Looking first at the countries that increased, Japan led the way going from $271,100,000 in 2010 to $287,400,000 before a surge to $325,300,000 by the end of the period. 2. China showed a similar growth pattern increasing by approximately $10,000,000 a year to end at $94,000,000. 3. Russia imported less, starting under a million at $968,000, nearly doubling to $1,585,000 and importing $2,494,000 worth of Kiwis by 2012.
- Begin talking about one area of the table. I group together the countries with increasing imports.
- Compare one country to another – notice that I say they had similar growth patterns.
- Make sure that you include all date, for all countries (sometimes you may need to group countries or data togethe with more complex tables/graphs).
1. In contrast, Mexican imports stood at $6,000,000 before falling by more than half to $2,400,000, and then recovering slightly to $3,300,000. 2. Saudia Arabia fell more steadily ($290,000 to $106,000 and finally $82,000).
- In this paragraph I describe the two countries with declining imports.
- Use parenthesis ( … ) sometimes so that your writing doesn’t get too repetitive.
Vocabulary
Can you think of a synonym for each of the words in bold below?
The given table organises the export value of Kiwis sent from New Zealand to five other countries in 2010, 2011, and 2012. The most striking feature of the graph is the overall numbers for Japan, which increased the most and were highest overall by far. Both China and Russia increased their imports and were second and fourth, respectively, while Mexico and Saudi Arabia’s export value declined, with Saudi Arabia importing the least by a significant margin.
Looking first at the countries that increased, Japan led the way going from $271,100,000 in 2010 to $287,400,000 before a surge to $325,300,000 by the end of the period. China showed a similar growth pattern increasing by approximately $10,000,000 a year to end at $94,000,000. Russia imported less, starting under a million at $968,000, nearly doubling to $1,585,000 and importing $2,494,000 worth of Kiwis by 2012.
In contrast, Mexican imports stood at $6,000,000 before falling by more than half to $2,400,000, and then recovering slightly to $3,300,000. Saudia Arabia fell more steadily ($290,000 to $106,000 and finally $82,000).
Answers
given presented
most striking feature what stands out the most
increased the most went up a lot
highest overall by far took up the largest proportion
respectively in turn
the least the lowest amount
by a significant margin by a lot
looking first at firstly
surge increase a lot
end of the period where the table finishes
similar growth pattern same increasing trend
end at finish at
nearly doubling increasing by nearly 100%
in contrast however
stood at was at
falling by more than half decreasing by over 50%
recovering slightly increasing a little
fell more steadily decreased at the same intervals
Pronunciation
ˈgɪvn
məʊst ˈstraɪkɪŋ ˈfiːʧə
ɪnˈkriːst ðə məʊst
ˈhaɪɪst ˈəʊvərɔːl baɪ fɑː
rɪsˈpɛktɪvli
ðə liːst
baɪ ə sɪgˈnɪfɪkənt ˈmɑːʤɪn
ˈlʊkɪŋ fɜːst æt
sɜːʤ
ɛnd ɒv ðə ˈpɪərɪəd
ˈsɪmɪlə grəʊθ ˈpætən
ɛnd æt
ˈnɪəli ˈdʌblɪŋ
ɪn ˈkɒntrɑːst
stʊd æt
ˈfɔːlɪŋ baɪ mɔː ðæn hɑːf
rɪˈkʌvərɪŋ ˈslaɪtli
fɛl mɔː ˈstɛdɪli
Listen and repeat:
Vocabulary Practice
Remember and fill in the blanks:
The _____________ table organises the export value of Kiwis sent from New Zealand to five other countries in 2010, 2011, and 2012. The _____________ of the graph is the overall numbers for Japan, which _____________ and were _____________. Both China and Russia increased their imports and were second and fourth, _____________, while Mexico and Saudi Arabia’s export value declined, with Saudi Arabia importing _____________ _____________.
_____________ the countries that increased, Japan led the way going from $271,100,000 in 2010 to $287,400,000 before a _____________ to $325,300,000 by the _____________. China showed a _____________ increasing by approximately $10,000,000 a year to _____________ $94,000,000. Russia imported less, starting under a million at $968,000, _____________ to $1,585,000 and importing $2,494,000 worth of Kiwis by 2012.
_____________, Mexican imports _____________ $6,000,000 before _____________ to $2,400,000, and then _____________ to $3,300,000. Saudia Arabia _____________ ($290,000 to $106,000 and finally $82,000).
Listen and check:
Listening Practice
Learn about kiwis in this video:
Reading Practice
Read a bit about kiwis here:


I would like to ask why you use import and export verb in an overall, Is it the same?
Great question! I use them both so I don’t have to repeat them over and over again. It depends on the perspective: New Zealand is exporting kiwis but the other countries are all importing kiwis.
Thanks a lot Dave!
You’re very welcome!
The graph shows details about the value of kiwi fruit exported from New Zealand to five various countries from 2010 to 2012. What stands out most is that Japan and China exported more kiwis compared to Mexico, Russia, and Saudi Arabia which only exported enough over three years.
In 2010, the value of exported kiwis to Japan was clearly outstanding at $271,000,000. The figure for Japan imports progressively rose in the following years, $287,400,000 in 2011 and $325,300,000 in 2012. These are the highest figures overall. An almost identical trend can be seen in the value of imports in China, from $74,900,000 in 2010 to $94,000,000 in 2012.
The value of exported kiwis from New Zealand to Mexico in 2010 stood at $6,000,000 before falling more than a half at $2,400,000 after a year, then increased slightly by $9,000 in 2012. However, a different movement of figures can be noticed in the imports of Russia, it started from $968,000 in 2010 and experienced a significant value escalation at $2,404,000 over two years. Saudi Arabia is the country that exports the least kiwis from New Zealand among the five countries. The value of their imports in 2010 was $290,000 and it plummeted to more than triple the amount at $82,000 in 2012.
Keep up the hard work!
The graph shows details about the value of kiwi fruit exported from New Zealand to five various countries from 2010 to 2012. What stands out most is that Japan and China exported more kiwis compared to Mexico, Russia, and Saudi Arabia which only exported enough over three years. What do you mean enough?
In 2010, the value of exported kiwis to Japan was clearly outstanding (don’t include opinion!) at $271,000,000. The figure for Japanese imports progressively rose in the following years, $287,400,000 in 2011 and $325,300,000 in 2012. These are the highest figures overall. An almost identical trend can be seen in the value of imports in China, from $74,900,000 in 2010 to $94,000,000 in 2012. Good data grouping!
The value of exported kiwis from New Zealand to Mexico in 2010 stood at $6,000,000 before falling more than a half at $2,400,000 after a year, then increased slightly by $9,000 in 2012. However, a different movement of the figures can be noticed in the imports of Russia, it started from $968,000 in 2010 and experienced a significant value escalation to $2,404,000 over two years. Saudi Arabia is the country that exports the least kiwis from New Zealand among the five countries. The value of their imports in 2010 was $290,000 and it plummeted to less than a third of that amount at $82,000 in 2012.
Thank you sir! What is the possible band score for this answer?
Fix the overview and it is in the band 7 range!
Thank you sir!
You’re welcome!
The table present data of the gross export value of kiwi from New Zealand to five different countries around the world during a three-year period between 2010 and 2012. Overall, Japanese value was the highest among all throughout the period with the most increase. Both China (second) and Russia (fourth) recorded remarkable steady growth in kiwi imports, whereas the value of Mexico and Saudi Arabia experienced a dramatic drop with Saudi Arabia showing the lowest value throughout by a significant margin.
To start with biggest importer, Japan showed a considerable growth from $271.1 million to $287.4 million in 2011 before a surge to as much as $325.3 million in 2012. Likewise, the figure of Russia jumped rapidly to $1.58 million from only $968,000 in 2010 in addition to almost another million of rise in 2011, while China experienced a steady increase of approximately $10 million per year to $94 million by the end of the period.
In contrast, Mexico and Saudi Arabia’s imports dropped dramatically by 60% and almost by half in turn in 2011. Even though the figure of Mexico climbed again to $3.3 million in 2012, the value of Saudi Arabia continued to decline to as low as merely $82,000.
Good work! Really good overview – do that on the test and include all the data and you will get at least band 7 for your task achievement.
Really nice grouping and comparing of the data as well.
Just be careful with little grammar mistakes like ‘figures for’ in the plural and ‘showed consiberable growth’!
This table illustrates the exports value in regards to the kiwi fruit sent from New Zealand to other five countries, including Japan, China, Mexico, Russia, and Saudi Arabia from the year 2010 to 2012.
It is obviously that the exports value kept a positive momentum in Japan, China and Russia in three consecutive years. In fact, New Zealand exported the most kiwi fruit to Japan for each year with the revenue of NZ$ 271.1 million, NZ$287.4 million and NZ$325.3 respectively. Even though China was the second largest market where the fruit were exported, the exports revenue was only at around 1/3 that of Japan. Also, the export value to Russia was increasing gradually and almost caught up with Mexico in 2012. However, the total exports amount was still remained in a lower level.
In contrast, the figure in Mexico fluctuated. There was a significant drawback in 2011, which made the revenue hit its minimum and was only about one half of the previous year. However, the data was recovered a bit in 2012 ($3.3 million). Furthermore, among all these five countries, Saudi Arabia was the only country that had a dramatic shrinking market for New Zealand kiwi fruit over these three years.
Please advise what possible band mark this will be. Thanks.
The table shows the total of export revenue of kiwi which is originated from New Zealand and sent to five nations between 2010 and 2012. It is noticeable that New Zealand gained the highest kiwi export from Japan throughout the period. The other countries experienced an increase in each year, except Mexico and Saudi Arabia.
In 2010, New Zealand supplied kiwi to Japan, accounted for $271,000,000. The value kept increasing significantly and reached $325,300,000 in 2012, which was the largest export value of kiwi compared to the remaining countries over the period shown. Followed by China, as the second-highest export earning, it showed a higher export value of approximately $10,000,000 in each year, from $74.9 million in 2010 to $94 million in 2012. Another nation, Russia, also rose from $968,000 to $2.404 million over a three-year period.
On the other hand, Mexico had fluctuated in terms of kiwi export from New Zealand. It started at $6 million in 2010, then decreased by $3.6 million in 2011 and increased to $2.404 million in 2012. Meanwhile, Saudi Arabia underwent a constant decline throughout the period, from $290,000 in 2010 to $82,000 in two years later.
Good work Carry!
You overview covers the full trend and you include all the data.
Be careful of mistakes with singular/plural, the definite article ‘the’ and past simple/past perfect confusion.
Keep it up!
while Mexico and Saudi Arabia’s export value declined, with Saudi Arabia importing the least by a significant margin.
Hi Dave
I don’t know …
Shall we use import value in this sentence
Mexico and Saudi Arabia’s import value declined
or
not
Thanks
Hello Dave,
I’ve looked up some dictionaries and see that the word “by + time” means “not later than, at/before”. So when you wrote “Russia imported less, starting under a million at $968,000, nearly doubling to $1,585,000 and importing $2,494,000 worth of Kiwis by 2012“, does this “by 2012″ mean the same as dictionaries define?
From what I’ve read, “by+time” usually indicates perfect tenses, but since you used the simple past tense in that sentence above, I am a bit confused now. Could you please help me to point out, in what situation “by + time” go with perfect tenses and when it does not?
Thank you!!!