This is an IELTS Writing Task 1 Sample Answer based on a bar chart showing the consumption and production of Electricity from the Cambridge IELTS 13 book real past tests.
This isn’t really a tough graph but, to be honest, it’s annoying.
There is a ton of data and it is really repetitive to just list all of it. This graph makes you question why this task exists at all because the visual chart is so much easier to understand compared to what you have to write about it.
But complaining about your lot in life only distracts you from the task at hand!
You can read below to see how I dealt with this annoying graph.
You can find my task 2 sample answers here.
If you need more help with task 1, try some of my posts here.
The recent questions from the IELTS writing task 2 exam are here, task 1 is here and the speaking questions and topics are here.
Good luck (to me and you)!
If you want to get my best materials and support me, please sign up for my exclusive IELTS Ebooks here on Patreon.
Dave
IELTS Writing Task 1 Sample Answer: Bar Chart Production and Consumption of Electricity (IELTS Cambridge 13)
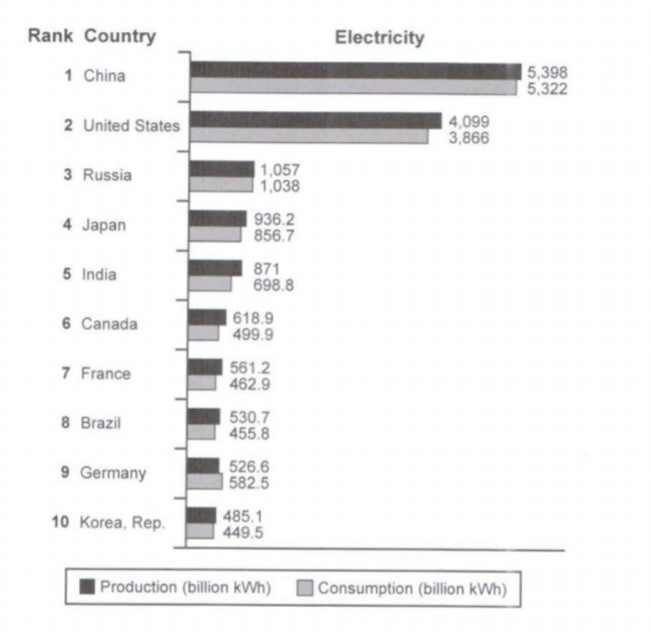
The bar chart below shows the top ten countries for the production and consumption of electricity in 2014.
Summarise the information by selecting and reporting the main features, and make comparisons where relevant.
IELTS Writing Task 1: Electricity Bar Chart (Cambridge 13) by Dave (former IELTS examiner)
The chart illustrates electricity consumption and production in the top ten highest countries in 2014. It is clear from the chart that all countries, with the exception of Germany, produce marginally more than they consume. The two top countries, the United States and particularly China, were strong outliers while the remaining countries had similar numbers and lagged far behind in both production and consumption.
China produced and consumed the most, at 5,398 billion and 5,322 kWh, respectively. The next nearest country in terms of both statistics was the US, where residents consumed 3,866 kilowats an hour and produced slightly more at 4,099.
Russian lead the rest of the nations with 1,057 (in production) and 1,038 kWh (consumption) followed by Japan (936.2 for production and 856.7 kWh for consumption). India and Canada ranked 5th and 6th with India producing 871 kWh and consuming 698.8 while Canada was slightly lower in both (618.9 and 499.9 kWh). In the 7th and 8th spots were France (producing 561.2 kWh and consuming 462.9) and Brazil, which recorded numbers at 530.7 and 455.8 for production and consumption, respectively. In the final two positions were Germany and the Republic of Korea with Germany having higher production that Korea (526.6 to 485.1 kWh) as well as consumption (582.5 kWh compared with 449.5).
Sample Answer Analysis
1. The chart illustrates electricity consumption and production in the top ten highest countries in 2014. 2. It is clear from the chart that all countries, with the exception of Germany, produce marginally more than they consume. 3. The two top countries, the United States and particularly China, were strong outliers while the remaining countries had similar numbers and lagged far behind in both production and consumption.
1. This first sentence simply paraphrases the topic – don’t waste a lot of time on this, it’s not really all that important.
2. This is the most important sentence in your whole IELTS test – the overview. Here I include the most general takeaway – which is that most countries produce more electricity than they consume.
3. My third sentence continues the overview by including the ranking for the countries – be sure to include this and aim for around 2 sentences for your overview to make sure you include enough detail
1. China produced and consumed the most, at 5,398 billion and 5,322 kWh, respectively. 2. The next nearest country in terms of both statistics was the US, where residents consumed 3,866 kilowats an hour and produced slightly more at 4,099.
1. The first sentence begins with China, the country at the top of the chart.
2. I then compare with the United States and conclude the paragraph. You should group together and compare the data logically and use paragraphs to build the structure of your essay.
1. Russian lead the rest of the nations with 1,057 (in production) and 1,038 kWh (consumption) followed by Japan (936.2 for production and 856.7 kWh for consumption). 2. India and Canada ranked 5th and 6th with India producing 871 kWh and consuming 698.8 while Canada was slightly lower in both (618.9 and 499.9 kWh). 3. In the 7th and 8th spots were France (producing 561.2 kWh and consuming 462.9) and Brazil, which recorded numbers at 530.7 and 455.8 for production and consumption, respectively. 4. In the final two positions were Germany and the Republic of Korea with Germany having higher production that Korea (526.6 to 485.1 kWh) as well as consumption (582.5 kWh compared with 449.5).
1. My second paragraph contains all the other information so it is much longer. I start with Russia and Japan.
2. Then move on to the next countries and compare them – India and Canada. All these countries have similar statistics so I just list them. If there were more distinct groups I would compare groups, rather than single countries.
3. Next are France and Brazil. Notice that I use different ways to include the data (sometimes parenthesis, sometimes just listing it). Don’t worry too much about varying it every time but you also shouldn’t use the exact same grammar and vocabulary for each sentence or it will be clear that you are reliant on a few simple structures and that will limit you to around band 6 for vocabulary and grammar.
4. My final sentence details the last two countries and compares them: Germany and Korea. You should always be comparing – every single sentence is some kind of comparision for IELTS Writing Task 1.
Vocabulary Practice
Can you think of a paraphrase or a synonym for each of the words in bold below?
The chart illustrates electricity consumption and production in the top ten highest countries in 2014. It is clear from the chart that all countries, with the exception of Germany, produce marginally more than they consume. The two top countries, the United States and particularly China, were strong outliers while the remaining countries had similar numbers and lagged far behind in both production and consumption.
China produced and consumed the most, at 5,398 billion and 5,322 kWh, respectively. The next nearest country in terms of both statistics was the US, where residents consumed 3,866 kilowats an hour and produced slightly more at 4,099.
Russian lead the rest of the nations with 1,057 (in production) and 1,038 kWh (consumption) followed by Japan (936.2 for production and 856.7 kWh for consumption). India and Canada ranked 5th and 6th with India producing 871 kWh and consuming 698.8 while Canada was slightly lower in both (618.9 and 499.9 kWh). In the 7th and 8th spots were France (producing 561.2 kWh and consuming 462.9) and Brazil, which recorded numbers at 530.7 and 455.8 for production and consumption, respectively. In the final two positions were Germany and the Republic of Korea with Germany having higher production that Korea (526.6 to 485.1 kWh) as well as consumption (582.5 kWh compared with 449.5).
Answers
consumption: usage
top ten highest: among the ten largest producers and consumers
It is clear from the chart: it is readily apparent that
exception: except for, with only ____ bucking this trend, showing a different trend
marginally: slightly, barely
particularly: especially
outliers: standing out, well beyond, leading/far behind
lagged far behind: by far the lowest/least
respectively: in turn
statistics: numbers, figures, production, consumption
residents: people living there, population
the rest of: the remaining nations
followed by: next, after that, trailing, leading
slightly lower: just below/under
recorded: noted, shown in the graph
as well as: and, also, in addition to
Pronunciation:
kənˈsʌm(p)ʃən
tɒp tɛn ˈhaɪɪst
ɪt ɪz klɪə frɒm ðə ʧɑːt
ɪkˈsɛpʃən
ˈmɑːʤɪnəli
pəˈtɪkjʊləli
ˈaʊtˌlaɪəz
lægd fɑː bɪˈhaɪnd
rɪsˈpɛktɪvli
stəˈtɪstɪks
ˈrɛzɪdənts
ðə rɛst ɒv
ˈfɒləʊd baɪ
ˈslaɪtli ˈləʊə
rɪˈkɔːdɪd
æz wɛl æz
Grammar Practice
I put some simple grammar mistakes with articles and tense in it this time – can you find and correct the grammar mistakes?
The chart illustrated (illustrates) electricity consumption and production in top ten highest countries in 2014. It is clear from a chart that all countries, with the exception of Germany, are producing marginally more than they consume. The two top countries, United States and particularly China, were strong outliers while the remaining countries had had similar numbers and lagged far behind in both production and consumption.
China produced and consumed the most, at 5,398 billion and 5,322 kWh, respectively. The next nearest country in terms of both statistics was the US, where residents have consumed 3,866 kilowats an hour and produced slightly more at the 4,099.
Russian lead the rest of nations with 1,057 (in production) and 1,038 kWh (consumption) followed by Japan (936.2 for production and 856.7 kWh for consumption). India and Canada rank 5th and 6th with India producing 871 kWh and consuming 698.8 while Canada was slightly lower in both (618.9 and 499.9 kWh). In a 7th and 8th spots were France (producing 561.2 kWh and consuming 462.9) and Brazil, which recorded numbers at 530.7 and 455.8 for production and consumption, respectively. In the final two positions was were Germany and Republic of Korea with Germany having higher production that Korea (526.6 to 485.1 kWh) as well as consumption (582.5 kWh compared with 449.5).
Answers
The chart illustrates electricity consumption and production in the top ten highest countries in 2014. It is clear from the chart that all countries, with the exception of Germany, produce marginally more than they consume. The two top countries, the United States and particularly China, were strong outliers while the remaining countries had similar numbers and lagged far behind in both production and consumption.
China produced and consumed the most, at 5,398 billion and 5,322 kWh, respectively. The next nearest country in terms of both statistics was the US, where residents consumed 3,866 kilowats an hour and produced slightly more at 4,099.
Russian lead the rest of the nations with 1,057 (in production) and 1,038 kWh (consumption) followed by Japan (936.2 for production and 856.7 kWh for consumption). India and Canada ranked 5th and 6th with India producing 871 kWh and consuming 698.8 while Canada was slightly lower in both (618.9 and 499.9 kWh). In the 7th and 8th spots were France (producing 561.2 kWh and consuming 462.9) and Brazil, which recorded numbers at 530.7 and 455.8 for production and consumption, respectively. In the final two positions were Germany and the Republic of Korea with Germany having higher production that Korea (526.6 to 485.1 kWh) as well as consumption (582.5 kWh compared with 449.5).
Links
Here is my live lesson on task 1 writing overviews from my YouTube channel.
Here is a very long BBC documentary about the Story of Electricity.
If you’re interested in Static Electricity for some reason then look no further.
Watch about Benjamin Franklin to learn his relationship to electricity and maybe use him as an important example on the test at some point.
You can find some useful images for task 1 writing here on HowtodoIELTS’ Instagram.
Comment Below:
Do you leave the lights on in your house when you go out?
How much is your monthly electricity bill?
Which devices in your house consume the most energy?
Where does energy come from primarily in your country? Solar panels? Coal? Nuclear? Oil?


Hi
I noticed you have used 20 times the words produced and consumed, and I don’t think this is good, don’t you? Regarding the vocabulary (lexical resources)
Haha, thanks for counting but that is fine because this graph is all about production and consumption. You can paraphrase to use, usage or add in words like total consumption and overal production. Don’t worry too much about paraphrasing especially with graphs focused on specific areas like this!
Hi. Thanks for your very well-organised answer. I really enjoyed reading it, and learned a lot. However, I noticed one grammatical slip from your answer. That is, ‘In the 7th and 8th spots were France (producing 561.2 kWh and consuming 462.9) and Brazil recorded numbers at 530.7 and 455.8 for production and consumption, respectively.’ This should be corrected “In the 7th and 8th spots were France (producing 561.2 kWh and consuming 462.9) and Brazil, which recorded numbers at 530.7 and 455.8 for production and consumption, respectively. Can you see what I’m getting at?
Yes, you’re absolutely right – I will fix that – thank you for the feedback and sharp eyes!
There is a ton of data and it is really repetitive to just list all of it. This graph makes you question why this task exists at all because the visual chart is so much easier to understand compared to what you have to write about it.
Couldn’t have said it better myself!
There is a ton of data and it is really repetitive to just list all of it. This graph makes you question why this task exists at all because the visual chart is so much easier to understand compared to what you have to write about it.
Couldn’t have said it better myself!
Please could you look at my writing. Thank you very much!
The chart reveals the electricity production and consumption in top ten leading countries in 2014.
In general, China topped the list in both production and consumption while Korea was the country with the smallest amount of produced and used electricity. Additionally, most countries, except for Germany, generated more electricity than they used.
As can be seen from the chart, China had by far the greatest amount of electricity production at 5,398 billion kWh and consumption at 5,322 billion kWh. It was followed by the United States with 4,099 billion kWh in production and 3,866 billion kWh in consumption. By contrast, Korea only produced 485.1 billion kWh and used 449.5 billion kWh, which was around one tenth of those of the other two countries.
The amount of electricity production in Brazil and Germany was slightly higher than that in Korea, but it was under 600 billion kWh. Furthermore, Germany used 582.5 billion kWh, which was even greater than that of Canada, where generated 618.9 billion kWh and consumed only 499.9 billion kWh.
Meanwhile, Russia recorded mostly equal amount of electricity production (1,057 billion kWh) and consumption (1,038 billion kWh). Japan produced and used more electricity than India, but the figures of these two countries did not exceed 1,000 billion kWh.
Thanks for writing Minh!
Here are some suggestions:
1. Your overview needs to touch on all countries – though that doesn’t mean you have to name them all. With this graph there are two countries that stand out and can be grouped together while the rest can all be grouped together. And is it most or all countries that generated more than they used? Try writing it again because for this overview you automatically have band 5 for task achievement…
2. The grammar, vocabulary and CC are all very strong but try to compare the data more and include data for all countries (Japan and India included).
Great work overall!
Hello, could you kindly take a look at my answer? Thank you so much.
The presented diagram demonstrates ten countries which produced and consumed the most electricity in 2014. Overall, the top two countries, China and United States, take the majority for both production and consumption, while the rest eight countries show the similar numbers.
China was the country which made and used the most electricity in the world with 5.398 kWh and 5,322 kWh respectively. The second ranked county, which was United States, followed up China very closely with 4,099 kWh for production and 3,866b kWh for consumption. The amount dropped a lot from the third ranked country. Russia produced and consumed about 1,000 kWh electricity and Japan chased them very closely with similar amount. The next following countries, India, Canada, France, Brazil, Germany, and Republic of Korea in order, showed similar numbers ranging from about 450 kWh to 870 kWh.
In conclusion, most countries produced more electivity than their usage. However, unlike other countries, only Germany consumed more electricity than they produced.
Sure, I’ll take a look!
Some feedback:
1. Your overview is good!
2. The conclusion overview is also really good.
3. You describe all the data – good work.
There are some small issues: don’t say ‘chased’, just say ‘followed’ instead of ‘followed up’ and just ‘The following countries’ instead of ‘The next following countries.’
Great!
The chart presents data on how many billion kWh of electricity was produced and consumed by ten countries in 2014. Looking from an overall perspective, it is readily apparent that China and the US were the largest producers and consumers of electricity, while Korea, Rep. used and produced less by a massive margin. Moreover, the production rates were slightly higher in all nations except in Germany, the consumption rate overweighed the other by a very small amount.
To start with the top, China produced most electricity in 2014 at 5.398 billion kWh, which was about 1,300 billion kWh more than the second position, the US. China and the US were also the biggest users, consuming 5,322 billion kWh and 3,866 billion kWh respectively in the given year. Figures of Russia, the third in rank, was substantially lower, amounted to 1,057 billion kWh in production and 1,038 billion kWh in consumption.
The remaining countries, such as Japan, India and Canada, accounted for a much smaller proportion of electricity, at approximately one forth the number of the US and one fifth of China. Finally, Korea appeared to be the least producer and consumer, at as low as 485.1 billion kWh and 449.5 billion kWh in turn.
Great – accurate!
The chart presents data on how many billion kWh of electricity was produced and consumed by ten countries in 2014. Looking from an overall perspective, it is readily apparent that China and the US were the largest producers and consumers of electricity, while Korea, Rep. used and produced less by a massive margin. Moreover, the production rates were slightly higher in all nations except in Germany, the consumption rate overweighed the other by a very small amount.
To start with the top, China produced most electricity in 2014 at 5.398 billion kWh, which was about 1,300 billion kWh more than the second position, the US. China and the US were also the biggest users, consuming 5,322 billion kWh and 3,866 billion kWh respectively in the given year.
The remaining countries led by Russia produced and used significantly less than the top two countries, ranging from 485.1 to 1,057 billion kWh (production) and from 449.5 to 1,038 billion kWh (consumption) in turn, which were less than one forth the number of the US and one fifth of China.
Great Jing!
Nice accurate description of the data – careful with your spelling.
PLEASE FEEDBACK
A quick glance at the given bar chart illustrates how many billion kWh of power the states where are by far the largest, manufactured and consumed in 2004. By active
The given bar chart, attached, shows how many billion kWh of power were manufactured and consumed from the top ten countries in past 2004. By passive
A significant fact to emerge from the bar chart is that both use and utilization of electricity in China and The United States were a majority at over 4,000.0 billion kWh in the among cities, for France, Brazil, Germany, and Korea, it was less than other countries at around 450 to 560 in the mentioned year.
In terms of the majority countries, not only, China prevalently generated and utilized the electricity, but also its the production and the usage were almost the same, at 5.398 and 5.322, respectively in 2004. The second was the USA, its indicator was less than by 1.000 from the first ones.
With regards to the minority countries, there was a rapid decline on the production and consumption of electricity, it commenced from Russia at around 1.000 and then decreased up to approximately 450. Additionally, among the period, all country’s the production more than the consumption apart from Germany where was 526.6 billion kWh of production and 582.5 billion of the utilization of the energy.
excellent answer… I think it should be Russia, not Russian. Sorry for the correction
Hello
Could you please evaluate? By the way, love our writng, Dave!
The bar chart shows the amount of how the top 10 leading nations utilized electricity based on its construction in 2014. The units are measured in billions aligned with kilowatt- hour .
Overall, it is readily apparent that , Germany consumed marginally more than they generated electricity. The top two countries, U.S.A and particularly China, were strong outliers and the remaining numbers had similar numbers and by far the lowest in terms of both production as well as utilization.
China manufactured and used with a figure of 5, 398 ( billion kwH) and 5322 ( billion kWh) respectively. Americans, in terms of both statistics, consumed 3,866 killowats an hour and produced just above at 4,099.
With regards to Russia , it led the remaining nations depicting the amounts of creation of 1057 kwh , and usage of 1,038 kwh. Following Japan had lesser consumption (856.7 kwh) compared to the production amount of 936.2 kwh. India was in the fifth position , generating 871 kWh and produced 698.8 kWh . Canada , produced 618 .9 kWh and used 499.9 kWh.Being the eight top country , Brazil also produced more quantity ( 530.7 kWh) than using the electricity of 455..8 kWh. In the final two positions were Geramany and Korea securing the last two postion among all the nations. Germany was the exception one of all, whose usage amount was more of 582.5 kWh than formation of 526.6 kWh. Latly, Korea produced 485.1 kWh and 449.5 kwh , the production of 485.1 kWh than consumption of 449.5 kWh.
Could you help me with my writing? Thanks!!
The bar chart provides data on the production and consumption of electricity in the ten highest-ranking countries in 2014.
Overall, it is clear that most countries produced more electricity than they consumed, with the exception of Germany. The statistics also reveal that the amount of electricity generated and used in China and the United States outnumbered the other countries in the year 2014.
Looking at the chart more closely, one can see that China produced the highest quantity of electricity, at 5.398 billion kWh, and also used more than any countries else (5.322 billion kWh). The figure for the US’s production was 1.3 billion lower than that of China, and
Americans consumed almost 3.866 billion kWh in 2014.
Russia led the remaining countries in terms of electricity generation and consumption, with the figures being 1.057 and 1.038 billion kWh in turn. The others showed a slight difference at around 50 to 100 billion kWh between the amount of electricity they produced and used. And it is interesting to note that Germany was the only nation that consumed more than they generated (526.6 billion kWh for production and 582.5 billion kWh for consumption).
Well written Anh!
Some really accurate data and comparison. What score are you going for on IELTS?
Hello,
Thanks for your sample it looks too comprehensive. I think you might combine some of the number and make it on average. One thing I noticed you used “France (producing 561.2 kWh and consuming 462.9” for this you are reporting date for 2014 is it correct you using the present continue tense?
It can never be too comprehensive, Adbul!
Combining and averaging would be too much math and odd for an IELTS question.
You can use present because the graph is showing it in the present.
Is that clear, Abdul?
hello Sir.. could you please look at my answer and give me a band score?
The bar chart illustrates the production and consumption of electricity of top ten countries in 2014.
As it is presents China had been produced both electricity and consumption while Korean republic had lowest level of production and c consumption each year, meanwhile German had been consumed electricity more then it produced in 2014. most probably it can be a minor point to a country . apart of German all of other countries had been utilized their electricity less then they produced.
In conclusion due to both Chine and United States were big countries both their production and consumption were very higher than other countries. nevertheless Russia also a big country but they had managed to reduce their both production and consumption in 2014. as well as France, Brazil, and German had been ,managed to keep their production level below 600 billion kWh in 2014, While these countries managed to keep their consumption level below 500 Billion kWh meanwhile Chine, Russia and Korea also managed to keep their both production and Consumption level as a same.
Nice work, Mohamed!
Careful with your punctuation especially – there are a lot of careless errors.
If you want band scores, you can sign up here: Patreon.com/howtodoielts
Hi, thanks very much for your amazing website imparting great tips to the candidates. One thing, for this bar chart and instead of listing the data, is it not better to describe and compare the two existing trends, producing compared to consuming electricity?
Thanks, Vahid – yes, your advice is good and students should follow it – always best to compare as much as possible!