
This sample answer is based on a real IELTS Writing Task 1 Bar Chart question on March 15th, 2018. I’m a former examiner so you can trust this answer. Keep reading for:
-
A quick analysis of the question.
-
Line by line analysis of the sample answer.
-
Vocabulary highlights and notes.
-
Interesting related links about sports!
As well as our Task 1 sample answers, check out our Task 2 sample essays here: IELTS Writing Task 2 Sample Answers.
You can also subscribe to our YouTube Channel for some IELTS Speaking Sample Answers: HowtodoIELTS YouTube.
Be sure to avoid the mistakes that most students make on writing by signing up for my exclusive IELTS Ebooks here on Patreon.
Here is the question:

Question Analysis
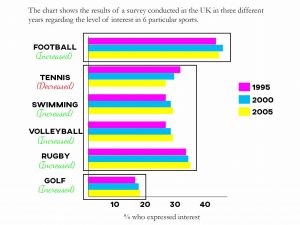
Looking at the bar chart, you can see it is divided into 3 years and 6 sports and it shows change over time.
I recommend making some quick notes on the general trends as well as the overall leaders because these will help to organise your writing later:
Sample Answer
The bar chart details the percentage changes of people in the UK interested in 6 sports between 1995 and 2005. In general, all sports saw gradual increases in interest over the full period with the exception of tennis. Football was by far the most popular throughout the period while tennis, swimming, volleyball and rugby had similar numbers and golf generated the least interest.
Football, the sport most people were interested in, rose from just under 40% in 1995 to around 45% in 2000 before a slight dip in 2005. Golf, the least popular sport, grew at steady intervals from just over 15% in 1995 to almost 20% interested in it by 2005.
The sports in the middle (tennis, swimming, volleyball, and rugby) had similar levels of interest at around 20 – 30% during the period. Rugby was the leader among this group with moderate gains starting at around 33% interested in 2005 and ending up with 35% by 2005. Volleyball and swimming showed nearly identical trends increasing steadily from just over 25% to slightly under 30%. The only sport to lose interest over the period was tennis which fell from over 30% in 1995 to under 30% in 2000 and nearly 25% by 2005.
Quick Analysis
I divided my answer into 3 paragraphs. Paragraph 1 is introducing that chart and the general overview. The general overview is by far the most important sentence of the whole essay because if you don’t have it, or it is not clear, you will get a Band 5 for Task Achievement. 100% – right away. Read more about overviews here.
Paragraphing is really important in Task 1. You can use your paragraphs to group together similar areas (or areas that are different in order to compare them) and it will give your writing structure.
This was a simple task 1, actually. Most of the sports increased and in the same way – gradually. There are some exceptions and a sport that is clearly the most popular and the least popular.
If you took the test this week, you got lucky with this question!
Paragraph 1: Introduction and Overview
1. The bar chart details the percentage changes of people in the UK interested in 6 sports between 1995 and 2005. 2. In general, all sports saw gradual increases in interest over the full period with the exception of tennis. 3. Football was by far the most popular throughout the period while tennis, swimming, volleyball and rugby had similar numbers and golf generated the least interest.
1. The first sentence introduces the chart, by paraphrasing (not copying) the question.
2. The second sentence begins the overview of the bar chart by describing the general trend (upwards for all sports except tennis).
3. The third sentence completes the overview by ranking the interest in each sport from the one people were most interested in to least interested in.
Paragraph 2: Detailed Figures (Football and Golf)
1. Football, the sport most people were interested in, rose from just under 40% in 1995 to around 45% in 2000 before a slight dip in 2005. 2. Golf, the least popular sport, grew at steady intervals from just over 15% in 1995 to almost 20% interested in it by 2005.
1. The first sentence describes the specific data for football, the sport most were interested in. I include all years and accurate data for those years. It’s important to say around/approximately because the exact numbers are not clear.
2. The second sentence describes golf, the least popular sport.
Paragraph 3: Detailed Figures (Other Sports)
1. The sports in the middle (tennis, swimming, volleyball, and rugby) had similar levels of interest at around 20 – 30% during the period. 2. Rugby was the leader among this group with moderate gains starting at around 33% interested in 2005 and ending up with 35% by 2005. 3. Volleyball and swimming showed nearly identical trends increasing steadily from just over 25% to slightly under 30%. 4. The only sport to lose interest over the period was tennis which fell from over 30% in 1995 to under 30% in 2000 and nearly 25% by 2005.
1. The first sentence is a topic sentence that groups together the sports in the middle of the bar chart.
2. The second sentence describes the leader among this group, rugby, with specific data and years.
3. The third sentence describes volleyball and swimming with specific data and years.
4. The fourth sentence describes the final sport, tennis, which was the only one to decrease over the full period.
Useful Vocabulary
Here is some vocabulary that you can use on your own IELTS Writing Task 1. I recommend that you take some good notes or try using this vocabulary in a different sample answer so that you don’t forget it:
The bar chart details the percentage changes of people in the UK interested in 6 sports between 1995 and 2005. In general, all sports saw gradual increases in interest over the full period with the exception of tennis. Football was by far the most popular throughout the period while tennis, swimming, volleyball and rugby had similar numbers and golf generated the least interest.
Football, the sport most people were interested in, rose from just under 40% in 1995 to around 45% in 2000 before a slight dip in 2005. Golf, the least popular sport, grew at steady intervals from just over 15% in 1995 to almost 20% interested in it by 2005.
The sports in the middle (tennis, swimming, volleyball, and rugby) had similar levels of interest at around 20 – 30% during the period. Rugby was the leader among this group with moderate gains starting at around 33% interested in 2005 and ending up with 35% by 2005. Volleyball and swimming showed nearly identical trends increasing steadily from just over 25% to slightly under 30%. The only sport to lose interest over the period was tennis which fell from over 30% in 1995 to under 30% in 2000 and nearly 25% by 2005.
details (v) – describes/illustrates
gradual increases (n) – small, steady rises
over the full period (prepositional phrase) – from the beginning of time on the graph to the end
with the exception of (prepositional phrase) – not including
by far (adverbial phrase) – by a lot or much more/less than
throughout the period (prepositional phrase) – from the beginning of time on the graph to the end
similar numbers (adj + n) – statistics that are almost the same
the least interest (adj + n) – the lowest level of interest
rose (v) – increased
just under (adverbial phrase) – a little but less than
around (adv) – approximately
slight dip (adj + n) – small decrease
grew at steady intervals (verb phrase) – increased steadily
almost (adv) – nearly/close to
similar levels of interest (noun phrase) – almost the same amount of interest
among this group (adverbial phrase) – included in this group
moderate gains (adj + n) – small increases
ending up with (verb phrase) – finishing with/having at the end
nearly identical trends (noun phrase) – almost the same pattern
just over (adverbial phrase) – a little bit more than
slightly under (adverbial phrase) – a little bit less than
nearly (adverb) – almost/close to
NOTES!
My gift for the lazy! If you got this far and didn’t take any notes of your own, consider this charity! You can find more notes like it on our Instagram page.


Fantastic
I always read your blog every day
Thank you so much! Nick and I are glad to hear that!
IT’s really helpful!
Thanks so much!
It’s helpful for my preparations
You’re welcome! Happy to help!
Very specific and clear answers Dave. Thanking you for providing these clear examples.
You’re very welcome!
The chart compares the popularity of six sports among UK citizens from 1995 to 2005. Overall, football was most popular throughout the given period, followed by rugby and tennis, while golf attracted the least people. Even though there were rises in most categories except for tennis and football, which in turn showed a decline and some fluctuations, the changes in number were minimal.
Looking in more details, the most popular sport, football, was interested by approximately 45 per cent of people in UK, however the number decreased after reaching a record high of nearly 50% of the population in 2000. Likewise, the third most popular sport of 1995, tennis, also experienced a drop of interest, from around 35% to a third by 2000 and continued to decrease to below 30%.
In contrast, rugby, which was second in rank through the years, recorded a steady growth of interest by about 1% per year from over a third in 1995. This upward trend also applied to swimming, volleyball and the least popular sport, golf. People displayed an identical growing interest for the former two sport, which increased from about 26% to 30% over the decade, while the figures of golf went up slightly but remained just under 20% throughout the year. (209 words)
Keep up the hard work, Jing! Great overview!
The bar chart illustrates the popularity of six different sports in UK over a ten-year period from 1995 to 2005. Looking from an overall perspective, it is readily apparent that football received the most interest throughout the period, followed by rugby and three other sports, while golf was least popular. In addition, all sports recorded growing attention, except for tennis.
Looking in more details, in 1999 approximately 45% of the interviewees showed interest in football. This number reached a record high of around 48% before a dip to about 46% by 2005. Rugby, the second most popular recreational activity, experienced an upward trend, with approximately 36% of public expressing kinship in this sport.
Swimming and volleyball displayed broadly identical patterns, with their interest levels grew from about 27% to 30% by the end of the period. Tennis, on the other hand, was followed by over one third of the population, which declined considerably to below 30% in 2005. In contrast, golf, the least common leisure option, experienced a gentle yet steady rise by about 1% each year to just under 20% in 2005.
The bar chart illustrates the popularity of six different sports in the UK over a ten-year period from 1995 to 2005. Looking from an overall perspective, it is readily apparent that football received the most interest throughout the period, followed by rugby and three other sports, while golf was least popular. In addition, all sports recorded growing participation, except for tennis.
Looking in more detail, in 1999 approximately 45% of the interviewees showed interest in football. This number reached a record high of around 48% before a dip to about 46% by 2005. Rugby, the second most popular recreational activity, experienced an upward trend, with approximately 36% of the public expressing kinship in this sport.
Swimming and volleyball displayed broadly identical patterns, with their interest levels growing from about 27% to 30% by the end of the period. Tennis, on the other hand, was followed by over one third of the population, which declined considerably to below 30% in 2005. In contrast, golf, the least common leisure option, experienced a gentle yet steady rise by about 1% each year to just under 20% in 2005.
Great writing!
Overall cellular phone service users made the greatest increase over the period while other services rose slightly except for landline service which fluctuated and dipped a little in 2008.
Good work, Seckin – you should mention that it was stable overall to be safe!
A breakdown of the analysis regarding the percentages of people in the UK interested in 6 different sports between 1995 and 2005 is depicted in the bar chart. Looking for an overall analysis, it is readily apparent that all of sports saw an upward trend over the period with the exception of tennis. Football was by far the most popular sport during the period while tennis, swimming, volleyball and rugby had a similar number and golf was the least popular.
Perfect, Nin!
The bar chart illustrates the details about the interest measurement of six different kinds of sports in the UK from 1995 to 2005. Looking from an overall perspective, it is readily apparent that football was the far the largest popular sport, on the other hand, Golf was the least famous sport. Except for Tennis, all other sports of swimming, volleyball, rugby and golf showed upward trend over ten years.
Looking in details, Football recorded 40% interest in 1995, increased to approximately 45% in 2000 before dip into about 42% in 2005. As per the survey, the interest percentage of Tennis, swimming, volleyball, rugby was around 25% to 35% while Rugby was the most popular sport among them. The least famous sport of Gulf recorded about 15% in 1995 and gradually increased to 20% by 2005.
In contrast, Tennis was only sport that showed a declining trend among the other sports for the period under consideration. It had a sharp downward interest which was 33% in 1995 and declined significantly to 27% in 2005.
Impressive, Mihidan!
Great coving the full trend – but the names of sports are not proper nouns so they don’t require capitalization!
Nice, Mihidan – careful with spelling and don’t capitalize the sports!