This is an IELTS Writing Task 1 sample answer bar chart related to what organisations A – E spent on various areas.
It is a very typical IELTS writing task 1, but there are a lot of areas to write about so that makes it a little bit more complex.
You can read about another bar chart from IELTS here.
Be sure to check out my Patreon exclusive essays as well.
Dave
Before reading, listen to my audio of the answer and try to draw the bar chart as accurately as you can to improve your listening skills. Listen to it more than once if you have to:
IELTS Writing Task 1 Sample Answer: Organisations Bar Chart (Real Past IELTS Tests/Exams)
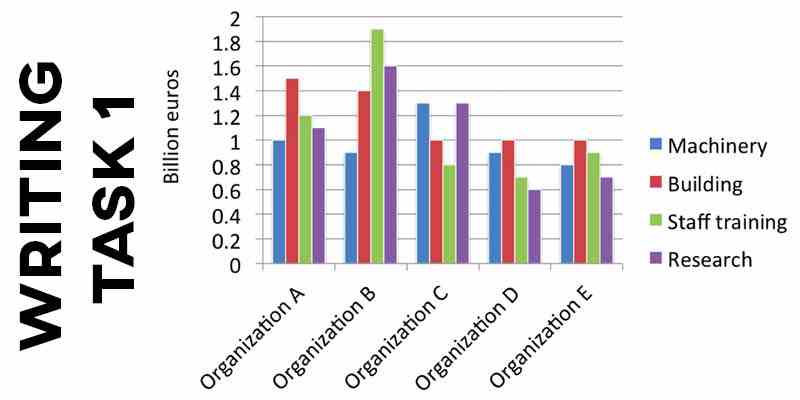
The chart below gives information about billions of euros invested in four areas by various organisations.
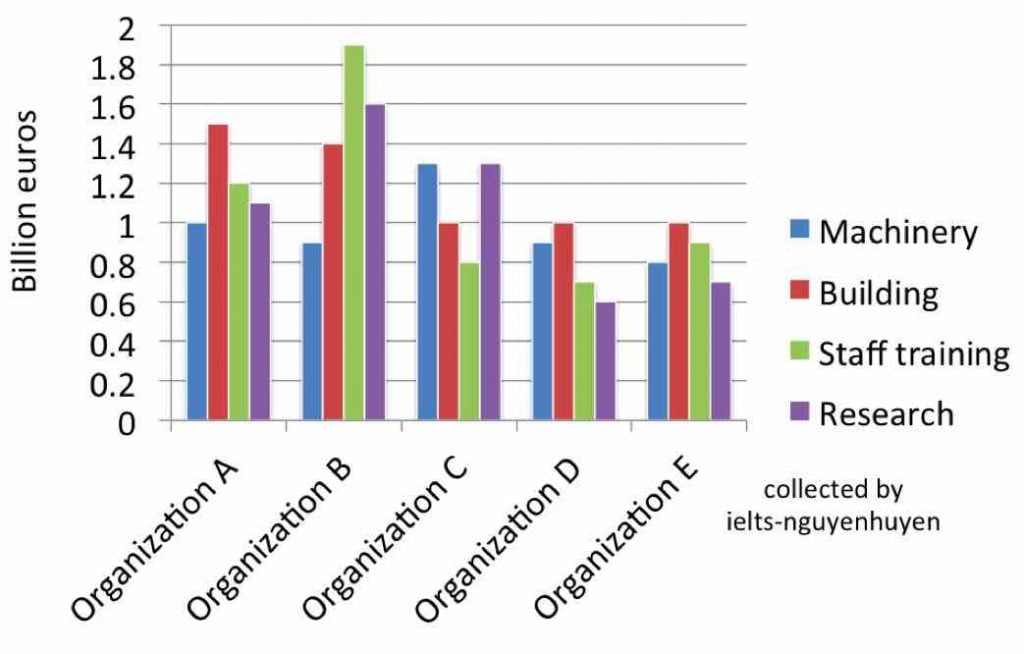
The bar chart details funding to four sectors by organisation A-E in a given time period. What stands out most is that overall expenditure is highest for organisation B, in particular staff training and research are outliers compared to the other organisations, while organisations D and E were much lower in overall funding and A and C were in the middle. There were varying trends for all organisations though building tended to be near the top for most of them.
Looking first of all at the funding for organisations A and B, machinery received €1 billion and just under a billion euros respectively, while building was the most funded for organisation A (€1.5 billion) and €.1 billion lower for B, trailing staff training (€1.9 billion) and research (€1.6 billion). Organisation A invested less in both areas with €1.2 for training and €1.1 for research.
The numbers for organisation C, D, and E were much lower with machinery at €1.1 billion for C, €.9 billion for D and €.8 billion for E. All three organisations invested equally in building (an even €1 billion), while staff training was between €.7 and €.9 billion for all groups. Research showed more divergent numbers with organisations C contributing €1.3 billion, organisation D €.6 billion and organisation E €.7billion.
Analysis
1. The bar chart details funding to four sectors by organisation A-E in a given time period. 2. What stands out most is that overall expenditure is highest for organisation B, in particular staff training and research are outliers compared to the other organisations, while organisations D and E were much lower in overall funding and A and C were in the middle. 3. There were varying trends for all organisations though building tended to be near the top for most of them.
- Paraphrase very simply what the graph shows – don’t waste time on this sentence.
- Write a general overview. It must touch on all areas but not include specific data.
- Usually you will need 2 sentences for your overview. 3 is too many.
1. Looking first of all at the funding for organisations A and B, machinery received €1 billion and just under a billion euros respectively, while building was the most funded for organisation A (€1.5 billion) and €.1 billion lower for B, trailing staff training (€1.9 billion) and research (€1.6 billion). 2. Organisation A invested less in both areas with €1.2 for training and €1.1 for research.
- Begin to talk about some of the organisations and include all the data. There is a lot of data here so I use parenthesis (…) to include some of it.
- Finish and make sure you wrote about all the data and it is accurate.
1. The numbers for organisation C, D, and E were much lower with machinery at €1.1 billion for C, €.9 billion for D and €.8 billion for E. 2. All three organisations invested equally in building (an even €1 billion), while staff training was between €.7 and €.9 billion for all groups. 3. Research showed more divergent numbers with organisations C contributing €1.3 billion, organisation D €.6 billion and organisation E €.7billion.
- Talk about the other areas – again with all the data.
- Compare the data as much as possible.
- Double check to make sure that you included all the data and your overview also includes all the organisations.
Vocabulary
Can you think of any synonyms for the words in bold below?
The bar chart details funding to four sectors by organisation A-E in a given time period. What stands out most is that overall expenditure is highest for organisation B, in particular staff training and research are outliers compared to the other organisations, while organisations D and E were much lower in overall funding and A and C were in the middle. There were varying trends for all organisations though building tended to be near the top for most of them.
Looking first of all at the funding for organisations A and B, machinery received €1 billion and just under a billion euros respectively, while building was the most funded for organisation A (€1.5 billion) and €.1 billion lower for B, trailing staff training (€1.9 billion) and research (€1.6 billion). Organisation A invested less in both areas with €1.2 for training and €1.1 for research.
The numbers for organisation C, D, and E were much lower with machinery at €1.1 billion for C, €.9 billion for D and €.8 billion for E. All three organisations invested equally in building (an even €1 billion), while staff training was between €.7 and €.9 billion for all groups. Research showed more divergent numbers with organisation C contributing €1.3 billion, organisation D €.6 billion and organisation E €.7billion.
Answers
details funding shows the money spend on
sectors areas
in a given time period over the period surveyed
what stands out most is the most striking feature is
overall expenditure total funding
in particular especially
outliers outside the norm
varying trends different patterns
tended inclined to
near the top almost the highest
received got
just under less than
respectively in turn
trailing behind
invested spent on
much lower a lot less
invested equally gave the same amount of money to
even equal
divergent numbers different statistics
contributing adding to
Pronunciation
ˈdiːteɪlz ˈfʌndɪŋ
ˈsɛktəz
ɪn ə ˈgɪvn taɪm ˈpɪərɪəd
wɒt stændz aʊt məʊst ɪz
ˈəʊvərɔːl ɪksˈpɛndɪʧə
ɪn pəˈtɪkjʊlə
ˈaʊtˌlaɪəz
ˈveəriɪŋ trɛndz
ˈtɛndɪd
nɪə ðə tɒp
rɪˈsiːvd
ʤʌst ˈʌndə
rɪsˈpɛktɪvli
ˈtreɪlɪŋ
ɪnˈvɛstɪd
mʌʧ ˈləʊə
ɪnˈvɛstɪd ˈiːkwəli
ˈiːvən
daɪˈvɜːʤənt ˈnʌmbəz
kənˈtrɪbju(ː)tɪŋ
Listen and repeat:
Vocabulary Practice
The bar chart d___________ to four s___________ by organisation A-E i ___________. W___________ that o___________ is highest for organisation B, i___________ staff training and research are o___________ compared to the other organisations, while organisations D and E were much lower in overall funding and A and C were in the middle. There were v___________ for all organisations though building t___________ to be n___________ for most of them.
Looking first of all at the funding for organisations A and B, machinery r___________ €1 billion and j___________ a billion euros r___________, while building was the most funded for organisation A (€1.5 billion) and €.1 billion lower for B, t___________ staff training (€1.9 billion) and research (€1.6 billion). Organisation A i___________ less in both areas with €1.2 for training and €1.1 for research.
The numbers for organisation C, D, and E were m___________ with machinery at €1.1 billion for C, €.9 billion for D and €.8 billion for E. All three organisations i___________ in building (an e___________ €1 billion), while staff training was between €.7 and €.9 billion for all groups. Research showed more d___________ with organisations C c___________ €1.3 billion, organisation D €.6 billion and organisation E €.7billion.
Listen and check:
Listening Practice
Watch this related video to practice:


The bar graph shows the amount of funding in machinery, building, staff training and research by different organizations. Overall, it is clear that organization B invested the most money among the five groups, while organization D spends less money in total.
Building and staff training are the areas that organizations most invested with. It can be seen that the amount of funding in staff training for organization B accounted as the highest figure in the graph at around 1.9 billion euros. In contrast, organization D is not that interested in spending money on staff training, just funded 0.7 billion euros. However, while organizations A and B invested more in building at 1.5 and 1.4 billion euros, respectively, organizations C, D, and E showed only enough interest in this area, with an investment of exactly 1 billion euros.
Research plays an important role in organization B, accounted for their second-most funded area at 1.6 billion euros. However, it could be noticed that this area is the lowest figure in the chart which can be found in organization D, accounted for only 0.6 billion euros. All five organizations just financed an appropriate amount for machinery. Figures for this category only stood at roughly 1 billion euros overall.
Thanks for writing Jessica!
Here are some corrections:
The bar graph shows the amount of funding in machinery, building, staff training and research by different organizations. Overall, it is clear that organization B invested the most money among the five groups, while organization D spends less money in total. (Your overview has to touch on all areas to get at least band 6.)
Building and staff training are the areas that the organizations invested in the most. It can be seen that the amount of funding in staff training for organization B accounted as the highest figure in the graph at around 1.9 billion euros. In contrast, organization D just funded it at funded 0.7 billion euros. However, while organizations A and B invested more in building at 1.5 and 1.4 billion euros, respectively, organizations C, D, and E showed only enough interest in this area, with an investment of exactly 1 billion euros. (Well written!)
Research plays an important role in organization B, accounting for their second-most funded area at 1.6 billion euros. However, it could be noticed that this area is the lowest figure in the chart which can be found in organization D, accounting for only 0.6 billion euros. All five organizations just financed machinery at roughly 1 billion euros overall.
Is that entirely accurate about the last point? I don’t think so… Be careful with accuracy!
Thank you again sir! Possible band score for this? Oh yes sir. My overview is very short and the last paragraph seems to be confusing.
This one is a bit lower than your Kiwis essay, a few more mistakes and not the same level of complex grammar.
thanku sir for this answer thanku so much
You’re very welcome!
first time i check your feedback and your answers it is too good it will help me in my next ielts exam
Hi Dave, Could you please check this ? I found this exercise as very difficult 🙁
The bar chart provides details regarding the amount of funding done by five organizations,Organization A to E, for main four fields namely, machinery, building, staff training and research, for a given period of time. Financial investments were illustrated by the unit, Euros (in Billions).
Overall, Organization B shows the largest financial allocation, specifically for staff training and research, while, organization C and A perform in the mid-level. Yet, Organization C, had spent the most for machinery and Organization A for building, in comparison with others whereas Organization D and E elucidate a lesser funding approach in every category.
Information shows that Organization A focuses mainly on building and exhibit the highest speculation on it (15.B Euros). Moreover, this organization funds more on other three as well, by contrast to the others such as E and D. Organization B, explicitly manifest the maximum expenditure on staff training (1.9B Euros) and research (1.6B Euroes) whereas Organization C present two equal funding for machinery and research,which is 1.3 B Euros.
Remaining two organizations (D and E) are the least in investments for all major sectors. Among them, Organization D is the minimally spent company for research and staff training and Organization E stands as the least in machinery. Finally, all three companies, C , D and E, have equally backed for buildings financially.
Hi Div,
That is a very tricky one but I think you did well enough with the overview – good work!
You need to be a bit more careful in your use of words. For example, we don’t say they have ‘equally backed for’ but you can say there was equal backing by organisations C, D, and E for buildings.
We also don’t use the phrase ‘Information shows…’ Try just copying the expressions in my sample answer such as ‘Looking in more detail,’
Thank you Dave. Your feedback encouraged me.
Could you please advice me regarding the specific tenses to be used in explaining various types of charts ? Thank you again !
It depends on the chart. If there is not date on it then use present tense, for most charts it will be in the past and use past/present perfect, sometimes there will also be some future tenses if it about predictions for the future.
The bar chart presents data on five organizations’ funding in machinery, building, staff training and research. Overall, organization B spent the most especially in staff training, followed by organization A, while organization D and E invested the least. Organization C was in the middle but it displayed a unique funding pattern compared with other organizations.
Looking at the chart in more details, most categories are allocated above 1 billion in organization A and B. The largest investment of organization A went to building at about 1.5 billion, followed by 1.2 billion in staff training. Organization B however invested 1.9 billion in staff training, which was the highest among all categories. 1.6 billion was spent on research which was much higher than that category in organization A at merely 1.1 billion. Besides, machinery received the least funding in both organizations, at 1 billion and .9 billion respectively.
Organization D and E displayed broadly similar patterns with both organizations investing the same amount (1 billion) on building. In contrast, least money went to research, at only .6 billion and .7 billion in turn. Organization C however spent the most in research at as much as 1.3 billion, which leveled up with its spending in machinery.
(202 words)
Great essay, Jing!
Careful with some of your vocabulary like ‘level up’ which we wouldn’t use to write about a graph.
What formal expressions could I use if I want to say the two figures are equal, or number A is the same to Number B?
are equal, were roughly equivalent, mirrored each other, also, comparable numbers, reflected
Hello Dave,
I hope you could shed some light on this. Thank you.
The bar chart compares the overall funding for machinery, building, training, and research in five different organizations.
It is clear that organization B had the highest expenditure on all categories, while organization D and E had the lowest investment. Additionally, building was the most funded, whereas machinery received the least money.
Organization B spent around 1.9 billion euros on its training, which is the highest figure shown on the chart. By contrast, the funding for organization D and organization E was below 1 million euros for all four groups. The amount spent by organization D on research, at 0.6 billion euros, was the lowest figure shown on the chart.
While organization A invested more money on building than on machinery, organization C allocated more funding to machinery than to building. Similarly, staff training received more money than research in organization A, whereas in organization C, the figures for these two categories were 1.3 billion euros and 0.8 billion euros respectively.
(160 words)
Hi Bryan – really nice writing.
Make sure your overview touches on all categories – including organisation C or you will get band 5 for task achievement.
No real mistakes in your writing – let me know what score you get on the actual test!
Hi Dave – really appreciate your reply and compliment.
When it comes to task 1 overview, particularly bar graphs, I often mention 1 to 2 common features and the most noticeable feature if relevant or a combination of them.
I didn’t realize that I was supposed to touch on all to get a higher score for task achievement.
“let me know what score you get on the actual test!” – sure, Dave.
Have a great day!
Yes, it is a bit of technicality but most examiners will be strict and put a ceiling on your score at 5 for TA.
An overview has to at least touch on every area. This can be tricky with some tables especially if there are a lot of areas.
Hope that clears it up for you!
Got it, Dave – a useful tip.
Keep working hard on this and hope that I will break that ceiling.
Many thanks!
Hi Dave! Your tips have been really useful for my study. May I get an estimated band for my writing for this?
The bar graph depicts the investment across five organizations in machinery, building, staff training and research training. Overall, it is readily apparent that organization D and E spent the most on building and the least on research whereas organization A and B spent the most on building and staff training respectively with both spending the least on research. Organization C had an equal investment on machinery and research.
To begin, organization D and E both shared highest investment on building at 1 billion euros each and the least on research at 0.6 billion euros and 0.7 billion euros respectively. The former had more investments on machinery than on staff training at around 0.9 billion euros and 0.7 billion euros respectively whereas the latter had 0.9 billion euros for staff training and 0.8 billion euros for machinery.
There was less investment seen in both organization A and B for machinery at 1 billion euros and 0.9 billion euros respectively. The latter, however, had more money on staff training (1.9billion euros) and research (1.6 billion euros) than the former at staff training (1.2 billion euros) and research (1.6 billion euros). Organization A shared more on building (1.5 billion euros) than organization A (1.4 billion euros).
Organization C had an equal amount of investment on machinery and research at 1.3 billion euros each, followed by 1 billion euros on building and 0.8 billion euros on staff training.
Hi Niks!
Your writing is really high level and though there are mistakes and some repitition. It will be for sure above band 7.