This is an IELTS writing task 1 sample answer essay on the topic of households with cars in a European country.
For my full, exclusive IELTS PDFs, learn more about my Patreon here.
Dave
IELTS Essay Task 1: Households with Cars

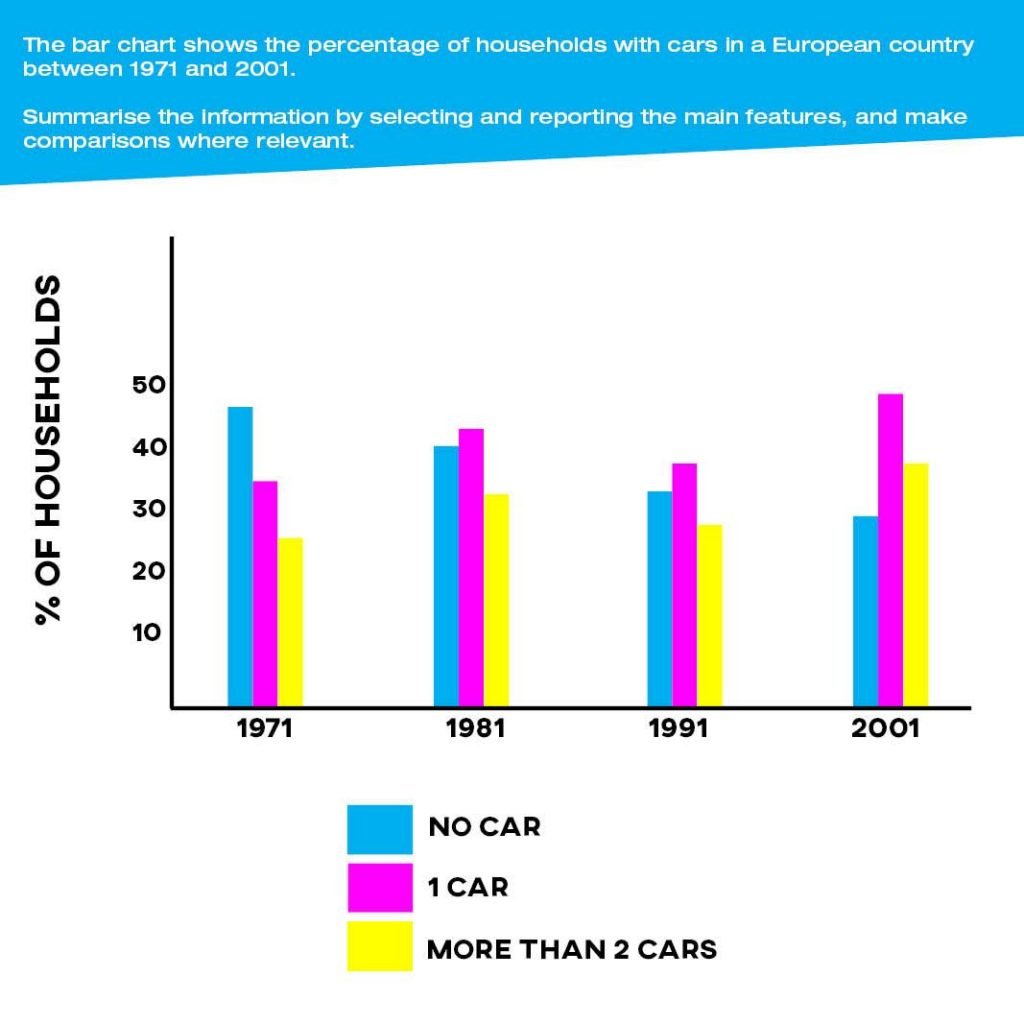
The bar chart compares the percentages for car ownership in a European country at 10 year intervals from 1971 to 2001. Looking from an overall perspective, it is readily apparent that proportions for households with no car and 1 car showed inverse patterns, with the latter rising to become most common by the end of the period. More than 2 cars increased as well, also overtaking no cars.
The number of homes in this European country with no car stood at just under 50% in 1971, before a steady decline by more than 5% each decade to finish at under 30% in 2001. In contrast, those houses with 1 car rose at less steady intervals from 35% to over 40% in 1981, followed by a dip to under 40% in 1991, and finally a surge to 50%.
More than 2 cars began the time surveyed with the lowest ratio (25%) then grew, mirroring the trajectory of 1 car and finishing at 35%, nearly 10% higher than no car households.
Analysis
1. The bar chart compares the percentages for car ownership in a European country at 10 year intervals from 1971 to 2001. 2. Looking from an overall perspective, it is readily apparent that proportions for households with no car and 1 car showed inverse patterns, with the latter rising to become most common by the end of the period. 3. More than 2 cars increased as well, also overtaking no cars.
- Paraphrase the overall essay topic.
- Begin your overview by describing the trends.
- Make sure all categories are covered. Learn more about overviews here.
1. The number of homes in this European country with no car stood at just under 50% in 1971, before a steady decline by more than 5% each decade to finish at under 30% in 2001. 2. In contrast, those houses with 1 car rose at less steady intervals from 35% to over 40% in 1981, followed by a dip to under 40% in 1991, and finally a surge to 50%.
- Start with one of the categories and include all the data.
- Always compare the categories.
1. More than 2 cars began the time surveyed with the lowest ratio (25%) then grew, mirroring the trajectory of 1 car and finishing at 35%, nearly 10% higher than no car households.
- Make sure that all areas and all data has been described fully and accurately.
Vocabulary
What do the words in bold below mean?
The bar chart compares the percentages for car ownership in a European country at 10 year intervals from 1971 to 2001. Looking from an overall perspective, it is readily apparent that proportions for households with no car and 1 car showed inverse patterns, with the latter rising to become most common by the end of the period. More than 2 cars increased as well, also overtaking no cars.
The number of homes in this European country with no car stood at just under 50% in 1971, before a steady decline by more than 5% each decade to finish at under 30% in 2001. In contrast, those houses with 1 car rose at less steady intervals from 35% to over 40% in 1981, followed by a dip to under 40% in 1991, and finally a surge to 50%.
More than 2 cars began the time surveyed with the lowest ratio (25%) then grew, mirroring the trajectory of 1 car and finishing at 35%, nearly 10% higher than no car households.
Answers
compares shows the differences between
10 year intervals every 10 years
Looking from an overall perspective, it is readily apparent that overall
proportions ratios
showed inverse patterns had the opposite trend
latter mentioned second
by the end of the period at the end of the graph
overtaking becoming higher than
stood was at
just under a little below
before preceding
steady decline regular decrease
more than above
decade 10 years
finish end
in contrast however
less steady intervals fluctuated more
followed by then
dip decrease
surge big increase
surveyed recorded
lowest ratio smallest numbers
mirroring reflecting
trajectory pattern
finishing at ending at
higher than above
Pronunciation
kəmˈpeəz
tɛn jɪər ˈɪntəvəlz
ˈlʊkɪŋ frɒm ən ˈəʊvərɔːl pəˈspɛktɪv, ɪt ɪz ˈrɛdɪli əˈpærənt ðæt
prəˈpɔːʃənz
ʃəʊd ɪnˈvɜːs ˈpætənz
ˈlætə
baɪ ði ɛnd ɒv ðə ˈpɪərɪəd
ˌəʊvəˈteɪkɪŋ
stʊd
ʤʌst ˈʌndə
bɪˈfɔː
ˈstɛdi dɪˈklaɪn
mɔː ðæn
ˈdɛkeɪd
ˈfɪnɪʃ
ɪn ˈkɒntrɑːst
lɛs ˈstɛdi ˈɪntəvəlz
ˈfɒləʊd baɪ
dɪp
sɜːʤ
sɜːˈveɪd
ˈləʊɪst ˈreɪʃɪəʊ
ˈmɪrərɪŋ
ˈtræʤɪktəri
ˈfɪnɪʃɪŋ æt
ˈhaɪə ðæn
Vocabulary Practice
Remember and fill in the blanks:
The bar chart c______________s the percentages for car ownership in a European country at 1_______________s from 1971 to 2001. L___________________________________________t p____________s for households with no car and 1 car s___________________________s, with the l___________r rising to become most common b____________________________d. More than 2 cars increased as well, also o_______________g no cars.
The number of homes in this European country with no car s_______d at j____________r 50% in 1971, b________e a s______________e by m___________n 5% each d___________e to f___________h at under 30% in 2001. I____________t, those houses with 1 car rose at l_________________s from 35% to over 40% in 1981, f____________________y a d___p to under 40% in 1991, and finally a s__________e to 50%.
More than 2 cars began the time s________________d with the l___________________o (25%) then grew, m______________g the t________________y of 1 car and f___________________t 35%, nearly 10% h_______________________n no car households.
Listening Practice
Watch the video below about car ownership in the future:
and a related speaking test here:
Reading Practice
Read more about this topic on The New York Times below:
https://www.nytimes.com/2020/08/12/style/car-buying-new-york-coronavirus.html
Speaking Practice
Practice with the following related topics from the real IELTS speaking exam:
Walking
- Do you go places on foot a lot?
- Did you walk more when you were younger?
- Why do some people prefer walking to driving a car?
- Do people in your country walk a lot?
Writing Practice
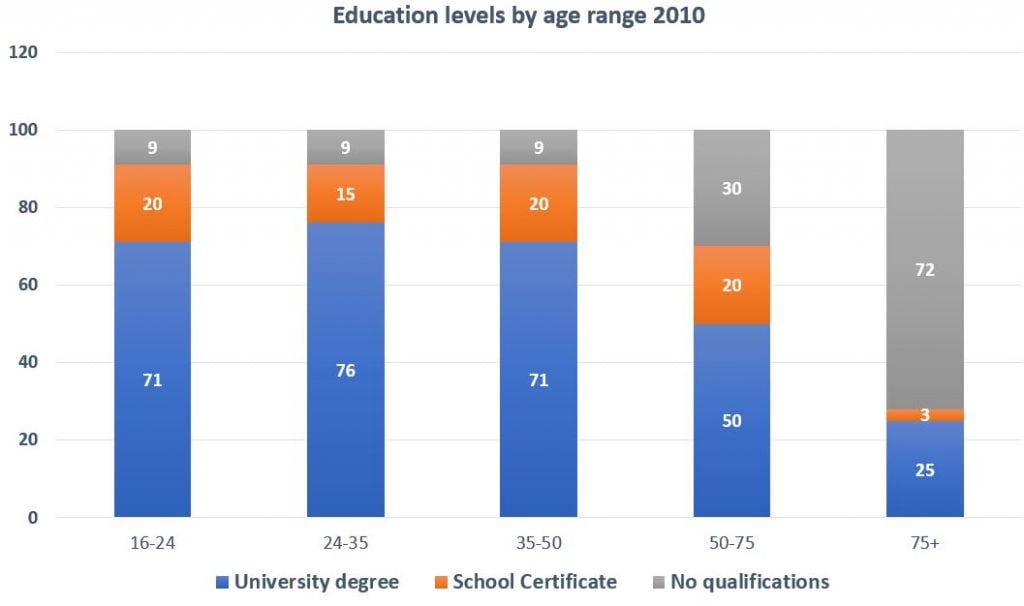
Write about the following related chart and then check with my sample answer:


This is a very good site. Also it is very helpful as well as useful. All the meanings are given here. I liked this site very much.
Thanks for saying that!
The bar chart depicts information about the proportion of cars in houses from 1971 to 2001 in a European country.
Overall, it is clear that the number of cars in Europe are increased over the decades. While the highest proportion of households did not owned a car in 1971 and in 2001 a large percentage of houses had a car.
We can see from the chart that around 45% of houses in that European country did not had a car after that it showed a downward trend over the decades with 40% in 1981 and about 35% in 1991 furthermore the proportion was declined to just under 30% in 2001.
When it comes to the houses which owned car. The houses with one car showed some fluctuations over the years. In 1971 35% had a car moreover, it figured on the top over the decades and finished with 50% in 2001. The percentage of more than 2cars were also showed a slight rise in a European country as it started with a minor proportion of 25% after that it displayed some changes over the decades. Furthermore, in 2001 the percentage rose significantly to around 40%
Good work, Albin!
Careful of run-on sentences, punctuation when you are listing items and your subordinate clauses.
Keep it up!
The bar chart depicts the information about the proportion of households with cars in a European country between 1971 and 2001.
Overall, In the European country, the volume of the household without cars steadily decreased and had one or two cars fluctuated widely throughout the period.
In 1971, 48% of households had no car, and 28% of European homes had more than 2 cars and 35% had 1 car. After 10 years, In 1981, 42% of European homes had 1 car whereas 40% had no car and only 32% of homes had more than 2 cars. After next 20 years, In 1991, 39% of European homes had 1 car whereas 38% had no car and only 36% of homes had more than 2 cars. After 30 years, In 2001, 52% of European homes had 1 car whereas 30% had no car and only 40% of homes had more than 2 cars.
To sum up, In the European country, the ratio of the homes without cars steadily dropped and had one or two cars varied widely throughout the period.
Well done Arfat!
Don’t just say fluctuation for your overview – be sure to say increase or decrease or you’ll end up with band 5 for task achievement.
Hloo
Hello Amarpal!
Useful site
You’re welcome, Botir!