This is an IELTS writing task 1 sample answer essay featuring a bar chart on the topic of education.
For more complete PDF essays, check out my Patreon here.
Dave
IELTS Task 1 Essay: Bar Chart (Education)
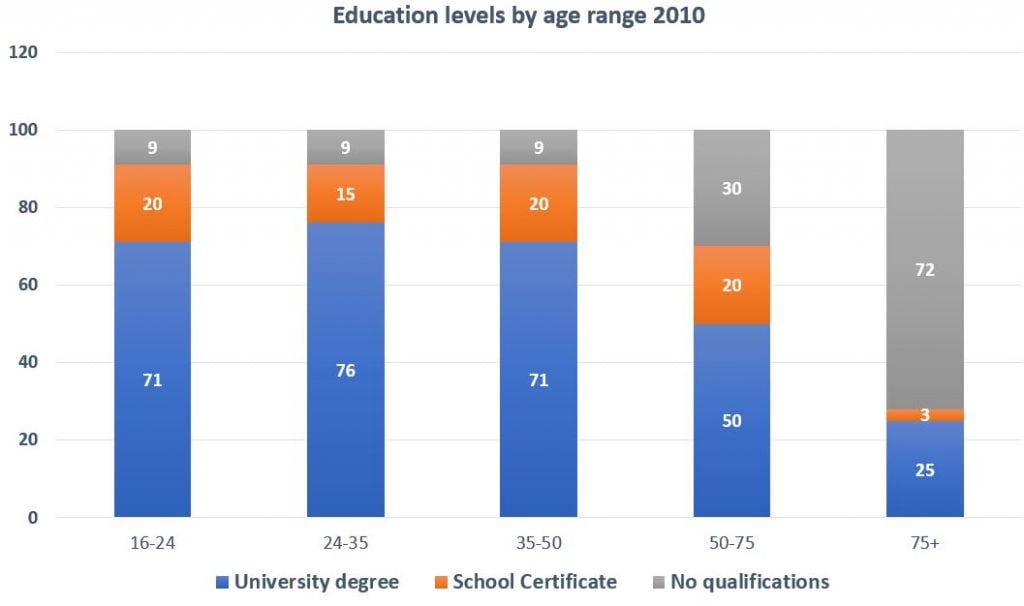
The chart below gives information about levels of education by age range in the UK in 2010.

The chart details age demographics as they relate to levels of education in the UK in 2010. Looking from an overall perspective, it is readily apparent that older people, particularly in the oldest age bracket, tended to have no or fewer qualifications.
Looking first of all at younger people, precisely 27% of individuals from ages 16-50 had no qualifications. Breaking that down further, 20% of the 16-24 and 35-50 groups had school certification and 71% had university degrees. For ages 24-35, the numbers are slightly different with 76% having graduated university and 15% with a school certification.
Turning to the older demographics, for those aged 50-75, 50% had a university degree, 20% a school certificate and 30% no qualification. This figure expanded to 72% for people over 75, with just 3% having earned a school certificate and 25% a university degree.
Analysis
1. The chart details age demographics as they relate to levels of education in the UK in 2010. 2. Looking from an overall perspective, it is readily apparent that older people, particularly in the oldest age bracket, tended to have no or fewer qualifications.
- Paraphrase what the graph shows.
- Write a general overview that fully covers all areas.
1. Looking first of all at younger people, precisely 27% of individuals from ages 16-50 had no qualifications. 2. Breaking that down further, 20% of the 16-24 and 35-50 groups had school certification and 71% had university degrees. 3. For ages 24-35, the numbers are slightly different with 76% having graduated university and 15% with a school certification.
- Begin to describe the data.
- Make sure that you include all data.
- And try to compare as much as possible.
1. Turning to the older demographics, for those aged 50-75, 50% had a university degree, 20% a school certificate and 30% no qualification. 2. This figure expanded to 72% for people over 75, with just 3% having earned a school certificate and 25% a university degree.
- Group together the other age groups and write about them.
- Finish with all the data and double check to make sure it is accurate.
Vocabulary
What do the words in bold below mean?
The chart details age demographics as they relate to levels of education in the UK in 2010. Looking from an overall perspective, it is readily apparent that older people, particularly in the oldest age bracket, tended to have no or fewer qualifications.
Looking first of all at younger people, precisely 27% of individuals from ages 16-50 had no qualifications. Breaking that down further, 20% of the 16-24 and 35-50 groups had school certification and 71% had unviersity degrees. For ages 24-35, the numbers are slightly different with 76% having graduated university and 15% with a school certification.
Turning to the older demographics, for those aged 50-75, 50% had a university degree, 20% a school certificate and 30% no qualification. This figure expanded to 72% for people over 75, with just 3% having earned a school certificate and 25% a university degree.
Answers
age demographics age groups
relate to have to do with
looking from an overall perspective, it is readily apparent that overall
age bracket age groups
tended to usually
qualifications degrees, certifications
looking first of all at beginning with
breaking that down further looking more deeply/closely
school certification a degree or paper from a school
slightly different almost the same
graduated university received a university degree
with who had
turning to looking next at
expanded gets bigger
earned received
Pronunciation
eɪʤ ˌdiːməˈgræfɪks
rɪˈleɪt tuː
ˈlʊkɪŋ frɒm ən ˈəʊvərɔːl pəˈspɛktɪv, ɪt ɪz ˈrɛdɪli əˈpærənt ðæt
eɪʤ ˈbrækɪt
ˈtɛndɪd tuː
ˌkwɒlɪfɪˈkeɪʃənz
ˈlʊkɪŋ fɜːst ɒv ɔːl æt
ˈbreɪkɪŋ ðæt daʊn ˈfɜːðə
skuːl ˌsɜːtɪfɪˈkeɪʃən
ˈslaɪtli ˈdɪfrənt
ˈgrædjʊeɪtɪd ˌjuːnɪˈvɜːsɪti
wɪð
ˈtɜːnɪŋ tuː
ɪksˈpændz
ɜːnd
Vocabulary Practice
What do the words in bold below mean?
The chart details a___________________s as they r___________o levels of education in the UK in 2010. L_________________________________________________t older people, particularly in the oldest a___________t, t___________o have no or fewer q_____________s.
L______________________t younger people, precisely 27% of individuals from ages 16-50 had no qualifications. B_________________________r, 20% of the 16-24 and 35-50 groups have s_______________________n and 71% have unviersity degrees. For ages 24-35, the numbers are s____________________t with 76% having g______________________y and 15% w____h a school certification.
T_______________o the older demographics, for those aged 50-75, 50% have a university degree, 20% a school certificate and 30% no qualification. This figure e____________d to 72% for people over 75, with just 3% having e__________d a school certificate and 25% a university degree.
Speaking Practice
Answer the following questions from the real IELTS speaking exam:
Studying
- Do you work or study?
- Why are you studying English?
- What will you do after graduating university?
Writing Practice


I still dont undertand “age democraphics” here
its the cool thing
That means groups of people, the age groups, Belle.
Hi, your writing’s samples are amazing and helpful
you wrote
Looking first of all at younger people, only 9% of individuals from ages 16-50 had no qualifications.
i suppose 9% + 9%+9% = 27%
“27% “of individuals from age 16-50 had no qualifications.
am i right ?
if i am wrong tell me in order to understand bar graphs better
thanks .
Yes, you are right, Negin – thanks for noticing that and I will update it!
It should be 9%, don’t get confused—(9+9+9)/(100+100+100)=9
Each one is 9% – for each demographic – in total, that means 27%, across all 3 demographics, had no qualifications. 9% in total wouldn’t make sense.
superb
Thank you, Kuljeet!
Ys
Sir I want to do writing task without year I don’t know how to do