IELTS Essay Task 1: Employment for Men and Women
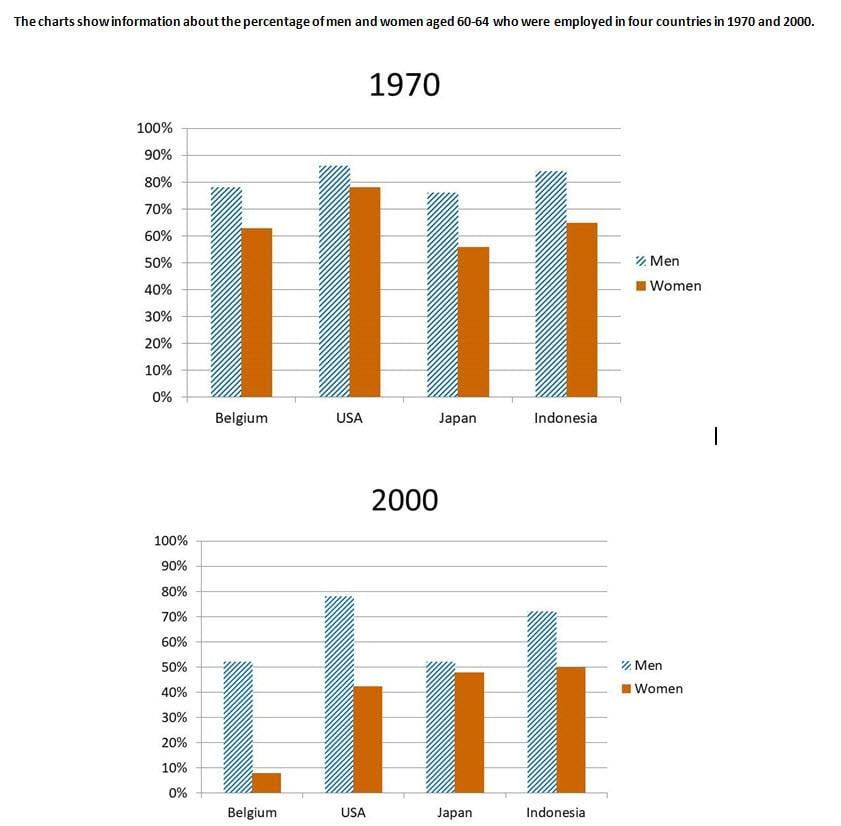
The bar charts detail men and women between the ages of 60 and 64 working in Belgium, the USA, Japan, and Indonesia in 1970 and 2000. Looking from an overall perspective, it is readily apparent that men had higher employment figures for all countries in both years with the largest disparity being the difference between men and women in Belgium and the USA in 2000. Proportions of males and females employed decreased across all nations, especially in Belgium.
In the United States in 1970, 88% of men between 60 and 64 were employed compared to just under 80% of women. These proportions were broadly similar to Belgium (79% and 62%) and Indonesia (83% and 63%). The disparity in Japan was slightly larger with 78% of men working and 55% of women.
By 2000, figures for the United States had declined to 79% of men and 41% of women, the second largest drop recorded. Belgium had the largest fall for female employment (down to fewer than 10% working) with a more moderate fall for men to 51%. In Indonesia, employed males fell to 72% as their counterparts slipped by 12% to 50%. Finally, Japan displayed the narrowest gap between genders with 51% of men working and 48% of women.
Analysis
1. The bar charts detail men and women between the ages of 60 and 64 working in Belgium, the USA, Japan, and Indonesia in 1970 and 2000. 2. Looking from an overall perspective, it is readily apparent that men had higher employment figures for all countries in both years with the largest disparity being the difference between men and women in Belgium and the USA in 2000. 3. Proportions of males and females employed decreased across all nations, especially in Belgium.
- Paraphrase what the bar chart shows.
- Write a clear overview summarising the differences.
- You might need another sentence for your overview.
1. In the United States in 1970, 88% of men between 60 and 64 were employed compared to just under 80% of women. 2. These proportions were broadly similar to Belgium (79% and 62%) and Indonesia (83% and 63%). 3. The disparity in Japan was slightly larger with 78% of men working and 55% of women.
- Begin writing about the data for the first categories.
- Make sure you compare as much as possible.
- Vary long and short sentences.
1. By 2000, figures for the United States had declined to 79% of men and 41% of women, the second largest drop recorded. 2. Belgium had the largest fall for female employment (down to fewer than 10% working) with a more moderate fall for men to 51%. 3. In Indonesia, employed males fell to 72% as their counterparts slipped by 12% to 50%. Finally, Japan displayed the narrowest gap between genders with 51% of men working and 48% of women.
- Write about the final other parts of the graph – include everything!
- Compare the categories.
- Finish with the rest of the data.
Vocabulary
What do the words in bold below mean? Take some notes on a piece of paper to aid your memory:
The bar charts detail men and women between the ages of 60 and 64 working in Belgium, the USA, Japan, and Indonesia in 1970 and 2000. Looking from an overall perspective, it is readily apparent that men had higher employment figures for all countries in both years with the largest disparity being the difference between men and women in Belgium and the USA in 2000. Proportions of males and females employed decreased across all nations, especially in Belgium.
In the United States in 1970, 88% of men between 60 and 64 were employed compared to just under 80% of women. These proportions were broadly similar to Belgium (79% and 62%) and Indonesia (83% and 63%). The disparity in Japan was slightly larger with 78% of men working and 55% of women.
By 2000, figures for the United States had declined to 79% of men and 41% of women, the second largest drop recorded. Belgium had the largest fall for female employment (down to fewer than 10% working) with a more moderate fall for men to 51%. In Indonesia, employed males fell to 72% as their counterparts slipped by 12% to 50%. Finally, Japan displayed the narrowest gap between genders with 51% of men working and 48% of women.
Answers
Try to write down or think of an antonym/opposite word for further practice:
detail show
between from … to ….
Looking from an overall perspective, it is readily apparent overall
employment figures numbers of people hired
largest disparity biggest difference
across all nations in all countries
especially in particularly in
compared to relative to
just under a little less than
proportions percentages
broadly similar almost the same as
slightly larger a little bigger
declined decreased
second largest drop recorded not the biggest fall
fewer than less than
moderate fall small drop
counterparts slipped opposites declined
displayed shown
narrowest gap smallest difference
genders male and female
Pronunciation
Practice saying the words below using this tip with Google voice dictation:
ˈdiːteɪl
bɪˈtwiːn
ˈlʊkɪŋ frɒm ən ˈəʊvərɔːl pəˈspɛktɪv, ɪt ɪz ˈrɛdɪli əˈpærənt
ɪmˈplɔɪmənt ˈfɪgəz
ˈlɑːʤɪst dɪsˈpærɪti
prəˈpɔːʃənz
əˈkrɒs ɔːl ˈneɪʃənz
ɪsˈpɛʃəli ɪn
kəmˈpeəd tuː
ʤʌst ˈʌndə
prəˈpɔːʃənz
ˈbrɔːdli ˈsɪmɪlə
ˈslaɪtli ˈlɑːʤə
dɪˈklaɪnd
ˈsɛkənd ˈlɑːʤɪst drɒp rɪˈkɔːdɪd
ˈfjuːə ðæn
ˈmɒdərɪt fɔːl
ˈkaʊntəpɑːts slɪpt
dɪsˈpleɪd
ˈnærəʊɪst gæp
ˈʤɛndəz
Vocabulary Practice
Remember and fill in the blanks. Note it on a piece of paper so you can remember better:
The bar charts d_________l men and women b_________n the ages of 60 and 64 working in Belgium, the USA, Japan, and Indonesia in 1970 and 2000. L__________________________________________t that men had higher e___________________s for all countries in both years with the l____________________y being the difference between men and women in Belgium and the USA in 2000. P________________s of males and females employed decreased a___________________s, e_______________n Belgium.
In the United States in 1970, 88% of men between 60 and 64 were employed c______________o j______________r 80% of women. These p_______________s were b_______________r to Belgium (79% and 62%) and Indonesia (83% and 63%). The disparity in Japan was s_________________r with 78% of men working and 55% of women.
By 2000, figures for the United States had d__________d to 79% of men and 41% of women, the s____________________________d. Belgium had the largest fall for female employment (down to fewer than 10% working) with a more m_____________l for men to 51%. In Indonesia, employed males fell to 72% as their c___________________d by 12% to 50%. Finally, Japan d___________d the n________________p between g_________s with 51% of men working and 48% of women.
Listening Practice
Listen to the related topic below and practice with these activities:
Reading Practice
Read more and use these ideas to practice:
https://www.washingtonpost.com/business/2021/11/17/how-to-quit-job/
Speaking Practice
Practice with the following related questions from the real IELTS speaking exam:
Work
- Where are you working at the moment?
- Do you want to work in another country?
- Do you like your job?
Writing Practice
Practice with the related chart below and then check with my sample answer:


Content is current and
Quite useful
Thanks Nandini – happy to hear that!
The bar charts illustrate the proportion of people of both sexes at the age of 60 to 64 working in Belgium, the U.S, Japan, and Indonesia in two separate years 1970 and 2000.
Overall, there were considerably more men than women employed in all four countries in both years with Belgium showing the most noticeable difference. Furthermore, the percentage of working men in all countries witnessed a significant drop in 2000, and a similar downward trend could be seen among women except for Japan whose figure rose marginally over the 30-year period.
Nearly 90% of male Americans were employed in 1970, as compared to barely under 80% of their female counterparts. The percentages of working men in Belgium and Japan were relatively similar with approximately 78% each, while the respective figures for women were much lower, at a little above 60% and 55%. The disparity in the employment figures between both genders was also significant in Indonesia with 85% of men and about 64% of women.
In 2000, there was a moderate decline of about 10% in the percentage of men employed in America, while the figure for female Americans almost halved to barely over 40%. The difference between the figures for working men and women in Belgium was more pronounced, dropping to slightly above 50% and almost 10%, respectively. However, the percentages of Japanese employees of both genders were comparatively similar with about 50% of men and 48% of women. Finally, a gap of 20% was seen in the figures for Indonesians with precisely half of the women working.
Great work Mike!
No mistakes that I can spot!
The percentages of working men in Belgium and Japan were relatively similar with approximately 78% each, while the respective figures for women were much lower, at a little above 60% and 55%.
i really don’t understand fully the use of with and at as I see it somewhere that with has to go with a noun but I see people use it the same way as at often
This is a common usage you will see in a lot of essays – no problem using it like this.
The bar chart compares the percentage of men and women who lie in the age group 60-64 working in four continents, namely Belgium, USA, Japan and Indonesia for the years 1970 and 2000.
Looking from an overall perspective, the number of both men and women working was higher during 1970 in comparison to 2000. Furthermore, the percentage of men employed have been greater than that of women in both years but this difference increased greatly across continents in 2000 with the exception of Japan where the percentage for men and women nearly matched.
During 1970, the share of men employed was more than 70% across all the continents whereas for women it was greater than 50%. There was drastic change in 2000, the employment percentage for men and women both declined. The major decrease was seen in the case of Belgium and Japan where proportion of men employed declined from just below 80% to just above 50%. Here, the major highlight was a huge drop in percentage of women employed in Belgium that came to less than 10% in 2000 from slightly more than 60% in 1970.
Coming to USA, the proportion of male employed dropped from 85% to slightly less than 80% during 30-year period but a significant drop was observed in proportion for women where it declined from just less than 80% to minutely more than 40%. However, in Indonesia the proportion for both the sexes decreased by almost 15 percentage points
A little on the long side but strong writing again, Simmi!
Be sure all data is included – at the end mention the starting and ending points for Indonesia.
what band score is this example?
All my essays are band 9 – since I write all of them, Gautam!