This is an IELTS writing task 1 sample answer essay on the topic of a bar chart showing museum admissions in London from the real IELTS exam.
Please consider supporting my efforts to creative high quality IELTS materials for students around the world by signing up for my Patreon (and so you won’t miss out on any of my exclusive IELTS Ebooks)!
Dave
IELTS Essay Task 1: Museums
The bar chart shows the number of visitors to four London museums.
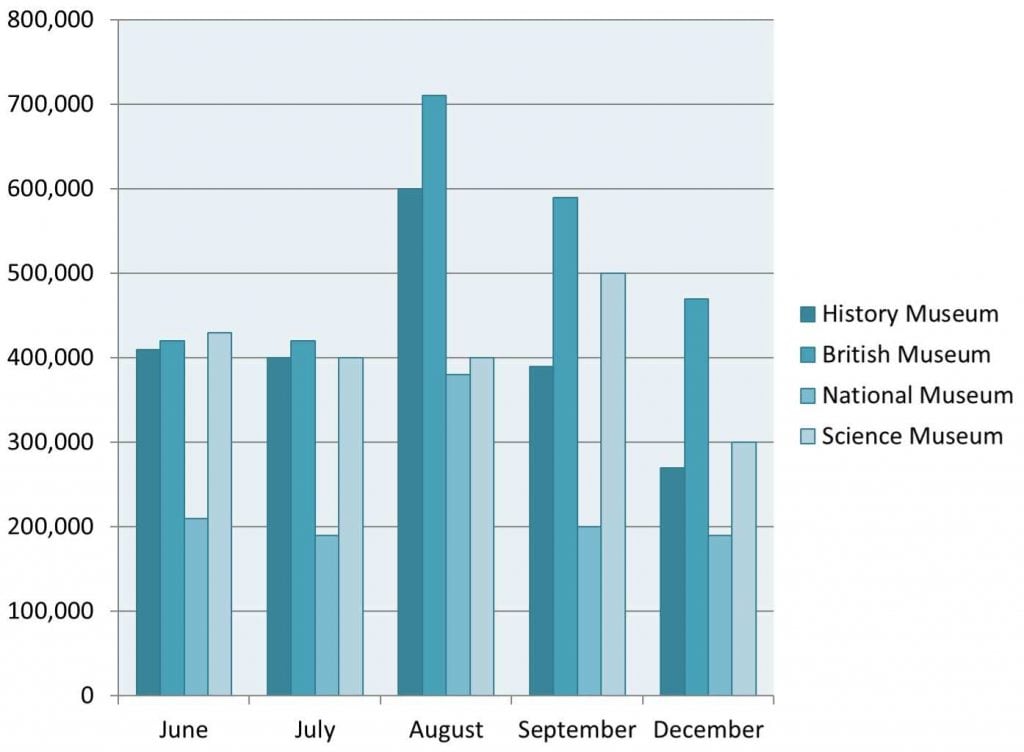
The bar chart compares attendance figures for museums in London over a period from June to December. Looking from an overall perspective, it is readily apparent that only the British Museum grew in popularity, while the others saw steep or moderate declines. In terms of overall figures, the British Museum was highest and the National Museum lowest throughout.
In June, the History Museum (410,000), the British Museum (420,000) and the Science Museum (430,000) had similar figures with the National Museum the outlier at just 210,000 visitors. Through July, numbers for all museums declined gradually, with the exception of the British Museum which was stable. August saw a shift in the pattern as the History and British Museum soared to 600,000 and 710,000, respectively. The Science Museum was unchanged but National Museum admissions doubled to 380,000.
By September, figures had fallen back to 390,000 and 590,000 for the History and British Museum, in turn, while the Science Museum rose to 500,000 visitors and the National Museum dipped to 200,000. At the end of the period, the History Museum continued to fall (270,000) along with the British Museum (470,000), National Museum (190,000), and the Science Museum (300,000).
Analysis
1. The bar chart compares attendance figures for museums in London over a period from June to December. 2. Looking from an overall perspective, it is readily apparent that only the British Museum grew in popularity, while the others saw steep or moderate declines. 3. In terms of overall figures, the British Museum was highest and the National Museum lowest throughout.
- Paraphrase what the graph shows.
- Write a clear overview summarising the major trends and differences.
- Add an extra sentence to be sure that you have covered everything.
1. In June, the History Museum (410,000), the British Museum (420,000) and the Science Museum (430,000) had similar figures with the National Museum the outlier at just 210,000 visitors. 2. Through July, numbers for all museums declined gradually, with the exception of the British Museum which was stable. 3. August saw a shift in the pattern as the History and British Museum soared to 600,000 and 710,000, respectively. 4. The Science Museum was unchanged but National Museum admissions doubled to 380,000.
- Begin writing about the differences.
- Compare as much as possible.
- Move on to the next category to describe.
- Try to include all the data you can.
1. By September, figures had fallen back to 390,000 and 590,000 for the History and British Museum, in turn, while the Science Museum rose to 500,000 visitors and the National Museum dipped to 200,000. 2. At the end of the period, the History Museum continued to fall (270,000) along with the British Museum (470,000), National Museum (190,000), and the Science Museum (300,000).
- Write about the rest of the information.
- Make sure you have detailed all the information.
Vocabulary
What do the words in bold below mean? Take some notes on a piece of paper to aid your memory:
The bar chart compares attendance figures for museums in London over a period from June to December. Looking from an overall perspective, it is readily apparent that only the British Museum grew in popularity, while the others saw steep or moderate declines. In terms of overall figures, the British Museum was highest and the National Museum lowest throughout.
In June, the History Museum (410,000), the British Museum (420,000) and the Science Museum (430,000) had similar figures with the National Museum the outlier at just 210,000 visitors. Through July, numbers for all museums declined gradually, with the exception of the British Museum which was stable. August saw a shift in the pattern as the History and British Museum soared to 600,000 and 710,000, respectively. The Science Museum was unchanged but National Museum admissions doubled to 380,000.
By September, figures had fallen back to 390,000 and 590,000 for the History and British Museum, in turn, while the Science Museum rose to 500,000 visitors and the National Museum dipped to 200,000. At the end of the period, the History Museum continued to fall (270,000) along with the British Museum (470,000), National Museum (190,000), and the Science Museum (300,000).
Answers
compares shows differences between
attendance figures number of people going there
period time
looking from an overall perspective, it is readily apparent that overall
grew in popularity more people went there
steep fast, large
moderate a little
in terms of when it comes to
highest biggest
lowest throughout smallest the whole time
similar figures numbers about the same
outlier exception
through to the end of
declined gradually went down slowly
exception different from the norm
stable unchanged
shift change
pattern trend
soared rose a lot
respectively in turn
unchanged stable
doubled increased 2x
fallen back decreased after increasing before
dipped fell
at the end of the period by the end of the time surveyed
continued to fall kept decreasing
Pronunciation
kəmˈpeəz
əˈtɛndəns ˈfɪgəz
ˈpɪərɪəd
ˈlʊkɪŋ frɒm ən ˈəʊvərɔːl pəˈspɛktɪv, ɪt ɪz ˈrɛdɪli əˈpærənt ðæt
gruː ɪn ˌpɒpjʊˈlærɪti
stiːp
ˈmɒdərɪt
ɪn tɜːmz ɒv
ˈhaɪɪst
ˈləʊɪst θru(ː)ˈaʊt
ˈsɪmɪlə ˈfɪgəz
ˈaʊtˌlaɪə
θruː
dɪˈklaɪnd ˈgrædjʊəli
ɪkˈsɛpʃən
ˈsteɪbl
ʃɪft
ˈpætən
sɔːd
rɪsˈpɛktɪvli
ʌnˈʧeɪnʤd
ˈdʌbld
ˈfɔːlən bæk
dɪpt
æt ði ɛnd ɒv ðə ˈpɪərɪəd
kənˈtɪnju(ː)d tuː fɔːl
Vocabulary Practice
Remember and fill in the blanks:
The bar chart c___________s a_______________s for museums in London over a period from June to December. L__________________________________t only the British Museum g____________________y, while the others saw s______p or m___________e declines. I_________f overall figures, the British Museum was h_______t and the National Museum l_________________t.
In June, the History Museum (410,000), the British Museum (420,000) and the Science Museum (430,000) had s_______________s with the National Museum the o__________r at just 210,000 visitors. T_________h July, numbers for all museums d________________y, with the e__________n of the British Museum which was s_______e. August saw a s______t in the p_________n as the History and British Museum s_________d to 600,000 and 710,000, r____________y. The Science Museum was u__________d but National Museum admissions d_______d to 380,000.
By September, figures had f_____________k to 390,000 and 590,000 for the History and British Museum, in turn, while the Science Museum rose to 500,000 visitors and the National Museum d_________d to 200,000. A___________________________d, the History Museum c__________________l (270,000) along with the British Museum (470,000), National Museum (190,000), and the Science Museum (300,000).
Listening Practice
Listen to the related topic below and practice with these activities:
Reading Practice
Read more and use these ideas to practice:
https://www.travelandleisure.com/attractions/museums-galleries/museums-with-virtual-tours
Speaking Practice
Practice with the following related questions from the real IELTS speaking exam:
Art
- Should kids be taught art from a young age?
- Is it important for all people to get the opportunity to make art?
- Should art be sold or kept in museums for the public to see?
- Why is art sold for such large sums of money?
- What is the attitude to art in your country?
Writing Practice
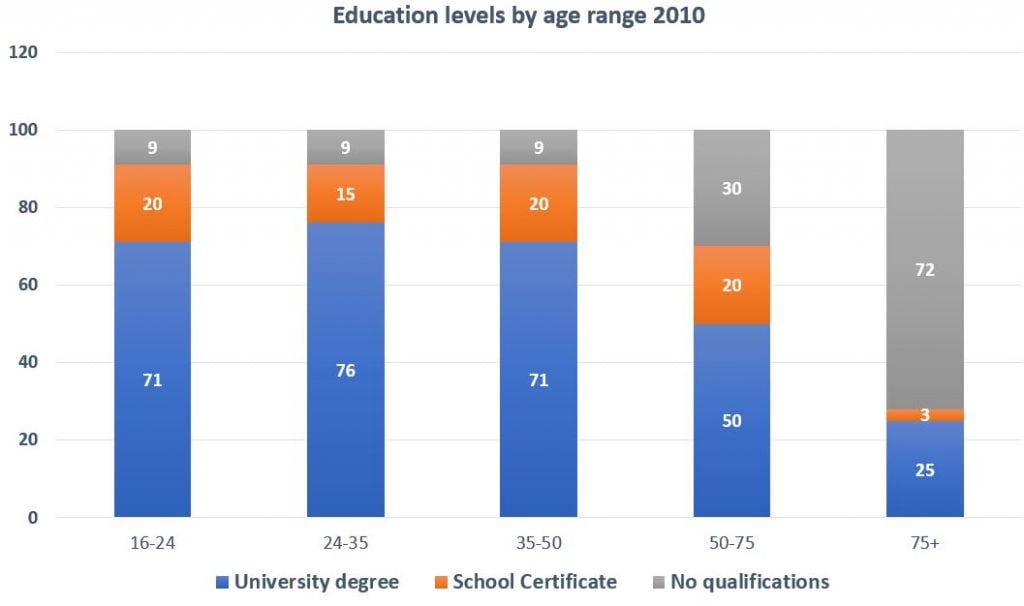
Practice with the related graph below related to film production in 5 countries and then check with my sample answer:


The bar chart compares attendance figures for 4 museums in London over a five-month period from June to December. The overall popularity for all museums declined over this period of time with the notable exception of the British museum in which more people went there. Furthermore, the British Museum was also the most popular apart from June.
The only two groups to see no change in attendance were the British Museum from June to July at approximately 420,000, and the Science Museum from July to August at exactly 400,000. For the other three months, the British Museum experienced a continued decrease from 720,000 in august to 460,000 at the end of the period. The trend for the History Museum was almost identical, but their numbers of visitors were always smaller as the gap widened dramatically: by 10,000 and 20,000 in the first two months, in turn, to less than 100,000 in august and 200,000 in the two final months.
The science museum started at the highest point of June with 430,000 admissions, soaring to precisely 500,000 in September before a pullback to 300,000 in December. Finally, the national museum stayed at around 200,000 for the majority of the time described, remaining the least popular museum despite a peak of 380,000 in august.
Nice writing!
Really good comparison of the data and very accurate as well.
Careful with some slightly informal verbs and capitilization – otherwise really strong!