This is an IELTS writing task 1 sample answer essay on the topic of U.S. energy consumption by fuel from 1980 to 2030.
You can also get my full EBooks below:
Dave
IELTS Essay: U.S. Energy Consumption by Fuel
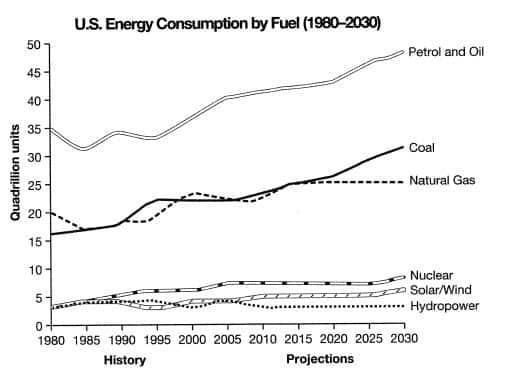
The line chart details fuel consumption from 1980 to 2030 in the United States. Looking from an overall perspective, it is readily apparent that petrol and oil have been and will continue to be the dominant fuel sources, followed by coal and natural gas, and more distantly by renewable energies. All varieties of fuel have increased and are expected to continue rising with the exception of hydropower which will remain stable overall.
Petrol and oil consumption stood at 35 quadrillion units in 1980 before a slight dip with minor fluctuations around 33 million quadrillion units until approximately 2000. From that point on, a steadier rise begins that is anticipated to reach nearly 50 quadrillion by 2030, by far the greatest data point in the chart. Coal and natural gas were considerably lower and displayed broadly similar trends. Natural gas began the period at 20 quadrillion units and coal was 4 quadrillion lower. Over the following years, the figures were erratic and their relative positions in the chart switched several times until coal began to separate itself around 2015, predicted to finish around 8 quadrillion units higher than natural gas at 30 quadrillion.
The consumption of cleaner energy sources was less significant with nuclear the highest, rising to just over 6 quadrillion by the end of the projections. Solar and wind power are slightly lower at near 5 quadrillion and hydropower underwent minor fluctuations to finish around 4 quadrillion units.
Analysis
1. The line chart details fuel consumption from 1980 to 2030 in the United States. 2. Looking from an overall perspective, it is readily apparent that petrol and oil have been and will continue to be the dominant fuel sources, followed by coal and natural gas, and more distantly by renewable energies. 3. All varieties of fuel have increased and are expected to continue rising with the exception of hydropower which will remain stable overall.
- Paraphrase what the bar chart shows.
- Write a clear overview summarising the differences.
- This one is a little complex so it needs a second sentence for the overview.
1. Petrol and oil consumption stood at 35 quadrillion units in 1980 before a slight dip with minor fluctuations around 33 million quadrillion units until approximately 2000. 2. From that point on, a steadier rise begins that is anticipated to reach nearly 50 quadrillion by 2030, by far the greatest data point in the chart. Coal and natural gas were considerably lower and displayed broadly similar trends. 3. Natural gas began the period at 20 quadrillion units and coal was 4 quadrillion lower. 4. Over the following years, the figures were erratic and their relative positions in the chart switched several times until coal began to separate itself around 2015, predicted to finish around 8 quadrillion units higher than natural gas at 30 quadrillion.
- Begin writing about the data for the first categories.
- Make sure you compare as much as possible.
- Keep using the units too.
- There is a lot of data so this essay is a little longer than normal.
1. The consumption of cleaner energy sources was less significant with nuclear the highest, rising to just over 6 quadrillion by the end of the projections. 2. Solar and wind power are slightly lower at near 5 quadrillion and hydropower underwent minor fluctuations to finish around 4 quadrillion units.
- Write about the final other parts of the graph – include everything!
- Compare the categories.
Vocabulary
The line chart details fuel consumption from 1980 to 2030 in the United States. Looking from an overall perspective, it is readily apparent that petrol and oil have been and will continue to be the dominant fuel sources, followed by coal and natural gas, and more distantly by renewable energies. All varieties of fuel have increased and are expected to continue rising with the exception of hydropower which will remain stable overall.
Petrol and oil consumption stood at 35 quadrillion units in 1980 before a slight dip with minor fluctuations around 33 million quadrillion units until approximately 2000. From that point on, a steadier rise begins that is anticipated to reach nearly 50 quadrillion by 2030, by far the greatest data point in the chart. Coal and natural gas were considerably lower and displayed broadly similar trends. Natural gas began the period at 20 quadrillion units and coal was 4 quadrillion lower. Over the following years, the figures were erratic and their relative positions in the chart switched several times until coal began to separate itself around 2015, predicted to finish around 8 quadrillion units higher than natural gas at 30 quadrillion.
The consumption of cleaner energy sources was less significant with nuclear the highest, rising to just over 6 quadrillion by the end of the projections. Solar and wind power are slightly lower at near 5 quadrillion and hydropower underwent minor fluctuations to finish around 4 quadrillion units.
Answers
For extra practice, write an antonym (opposite word) on a piece of paper to help you remember the new vocabulary:
details fuel consumption shows how much of a fuel source is used
Looking from an overall perspective, it is readily apparent that petrol and oil overall fuel for cars and industry
dominant fuel sources most used kinds of energy
followed by coal after that the black rock that comes from mining
natural gas a kind of fuel source
more distantly by renewable energies further behind by cleaner sources
varieties different kinds of
are expected to continue rising with the exception of hydropower will keep going up but not with energy from dams
remain stable overall stay the same by the end of the period
stood at was at the level of
before a slight dip with minor fluctuations around falling down a little with erratic rises and falls near
until approximately reaching the point around
From that point on after that
steadier rise begins going up consistently starts
anticipated to reach nearly expected to get to almost
by far the greatest data point in the chart the biggest number in the whole image
considerably lower much less
displayed broadly similar trends almost the same pattern
began the period at started at
Over the following years the next years
figures data
erratic fluctuating
relative positions where they stand in comparison
switched several times changed position a few times
separate itself go off in a different direction
predicted to finish around expected to end at
cleaner energy sources not polluting kinds of energy
less significant not as important
nuclear from radioactive sources
by the end of the projections at the time the graph finishes predictions
slightly lower a little less
near almost at
underwent minor fluctuations to finish around experienced ups and downs and ended near
Pronunciation
Practice saying the vocabulary below and use this tip about Google voice search:
ˈdiːteɪlz fjʊəl kənˈsʌm(p)ʃən
ˈlʊkɪŋ frɒm ən ˈəʊvərɔːl pəˈspɛktɪv, ɪt ɪz ˈrɛdɪli əˈpærənt ðæt ˈpɛtrəl ænd ɔɪl
ˈdɒmɪnənt fjʊəl ˈsɔːsɪz
ˈfɒləʊd baɪ kəʊl
ˈnæʧrəl gæs
mɔː ˈdɪstəntli baɪ rɪˈnjuːəbl ˈɛnəʤiz.
vəˈraɪətiz
ɑːr ɪksˈpɛktɪd tuː kənˈtɪnju(ː) ˈraɪzɪŋ wɪð ði ɪkˈsɛpʃən ɒv ˈhaɪdrəʊˌpaʊə
rɪˈmeɪn ˈsteɪbl ˈəʊvərɔːl
stʊd æt
bɪˈfɔːr ə slaɪt dɪp wɪð ˈmaɪnə ˌflʌktjʊˈeɪʃənz əˈraʊnd
ənˈtɪl əˈprɒksɪmɪtli
frɒm ðæt pɔɪnt ɒn
ˈstɛdɪə raɪz bɪˈgɪnz
ænˈtɪsɪpeɪtɪd tuː riːʧ ˈnɪəli
baɪ fɑː ðə ˈgreɪtɪst ˈdeɪtə pɔɪnt ɪn ðə ʧɑːt
kənˈsɪdərəbli ˈləʊə
dɪsˈpleɪd ˈbrɔːdli ˈsɪmɪlə trɛndz
bɪˈgæn ðə ˈpɪərɪəd æt
ˈəʊvə ðə ˈfɒləʊɪŋ jɪəz
ˈfɪgəz
ɪˈrætɪk
ˈrɛlətɪv pəˈzɪʃənz
swɪʧt ˈsɛvrəl taɪmz
ˈsɛprɪt ɪtˈsɛlf
prɪˈdɪktɪd tuː ˈfɪnɪʃ əˈraʊnd
ˈkliːnər ˈɛnəʤi ˈsɔːsɪz
lɛs sɪgˈnɪfɪkənt
ˈnjuːklɪə
baɪ ði ɛnd ɒv ðə prəˈʤɛkʃənz
ˈslaɪtli ˈləʊə
nɪə
ˌʌndəˈwɛnt ˈmaɪnə ˌflʌktjʊˈeɪʃənz tuː ˈfɪnɪʃ əˈraʊnd
Vocabulary Practice
The line chart d______________________________n from 1980 to 2030 in the United States. L______________________________________________________________________l have been and will continue to be the d_________________________________s, f____________________l and n_______________s, and m___________________________________s. All v____________s of fuel have increased and a______________________________________________________________r which will r__________________________l.
Petrol and oil consumption s__________t 35 quadrillion units in 1980 b_________________________________________________d 33 million quadrillion units u__________________________y 2000. F_____________________n, a s_________________________s that is a______________________________y 50 quadrillion by 2030, b_______________________________________t. Coal and natural gas were c_________________________r and d__________________________s. Natural gas b____________________t 20 quadrillion units and coal was 4 quadrillion lower. O_________________________s, the f___________s were e______c and their r__________________s in the chart s_______________________s until coal began to s_________________f around 2015, p______________________________d 8 quadrillion units higher than natural gas at 30 quadrillion.
The consumption of c__________________________s was l_____________________t with n__________r the highest, rising to just over 6 quadrillion b________________________________s. Solar and wind power are s_______________ at n__________r 5 quadrillion and hydropower u_________________________________d 4 quadrillion units.
Listening Practice
Reading Practice
Speaking Practice
Environment
- How are environmental problems dealt with in your country?
- What can be done to make people recycle more often?
- What is the most pressing environmental problem?
- Is recycling a common practice in your country?
- Are governments or individuals more responsible?
Writing Practice


The line graph indicates how the energy was consumed in the past for 6 sectors, and also indicates the predicted rates for them up until the year of 2030.
Overall, it can be viewed that the petrol and oil energy consumption was significantly higher than all the other categories. Nuclear, Solar and hydropower were relatively the same with the lowest quadrillion units while natural gas and coal in take fluctuated in the same range length.
In the early years, petrol and oil declined from 35 quadrillion units to just over 30 quadrillion units. The considerable fluctuations continued until the year 1995, when the consumption rate started to significantly increase. It is also foreseen that major escalations of the oil and petrol rates would continue and by 2030, it would reach the highest demand in the United States of America.
Nuclear, solar/wind and hydropower all initiated at the same lowest energy consumption units which was 3 quadrillion units. Until 7 years later, it had grown at the same amount and had later on split to hydropower being the lowest of them all, solar coming next and nuclear reaching almost the double units to that of hydropower.
There was actually a mistake in data for coal and natural gas. The natural gas began at 20 quadrillion units whereas, the coal began at about 16.5 quadrillion units.
Thanks for noticing that, Nima – updated!