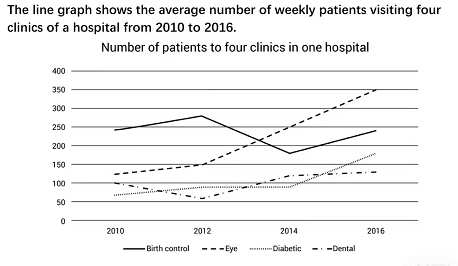
The line graph compares the average visitation figures for patients in four categories who went to clinics at a specific hospital weekly between 2010 and 2016. In general, it is noticeable that the number of patients at the four clinics increased for all types of visits except for birth control which was unchanged overall. The figure for eye issues became the most common over the period, overtaking birth control, while visits for diabetic and dental reasons were lower throughout.
There were nearly 250 visits related to birth control in 2010, a figure which rose to a peak of 275 by 2012, before a sharp decline to 175 in 2014, and a complete recovery to its starting figure by the end of the time surveyed. In contrast, visits to the doctor concerning eye issues started lower at 125, grew negligibly over the next two years, prior to surging in the final four years to a high point, relative to all visits, of 350.
Diabetic and dental visits were consistently less common with the former beginning at 60, rising steadily to plateau under 100, and finishing the period with a sharp uptick to 175. The latter began the period higher at 100 visits, fell to half that number in 2012, more than recovered to 125 in 2014, and grew marginally in the final two years recorded.
Analysis
1. The line graph compares the average visitation figures for patients in four categories who went to clinics at a specific hospital weekly between 2010 and 2016. 2. In general, it is noticeable that the number of patients at the four clinics increased for all types of visits except for birth control which was unchanged overall. 3. The figure for eye issues became the most common over the period, overtaking birth control, while visits for diabetic and dental reasons were lower throughout.
Paraphrase what the bar chart shows.
Write a clear overview summarising the differences and the overall trend.
This one is a little complex so it needs a second sentence for the overview.
1. There were nearly 250 visits related to birth control in 2010, a figure which rose to a peak of 275 by 2012, before a sharp decline to 175 in 2014, and a complete recovery to its starting figure by the end of the time surveyed. 2. In contrast, visits to the doctor concerning eye issues started lower at 125, grew negligibly over the next two years, prior to surging in the final four years to a high point, relative to all visits, of 350.
Begin writing about the data for the first categories.
Compare between each sentence.
1. Diabetic and dental visits were consistently less common with the former beginning at 60, rising steadily to plateau under 100, and finishing the period with a sharp uptick to 175. 2. The latter began the period higher at 100 visits, fell to half that number in 2012, more than recovered to 125 in 2014, and grew marginally in the final two years recorded.
Write about the final other parts of the graph – include everything!
Compare the categories.
Vocabulary
What do the words in bold below mean?Make some notes on paper to aid memory and then check below.
The line graph compares the average visitation figures for patients in four categories who went to clinics at a specific hospital weekly between 2010 and 2016. In general, it is noticeable that the number of patients at the four clinics increased for all types of visits except forbirth control which was unchanged overall. The figure for eye issues became the most common over the period, overtaking birth control, while visits for diabetic and dental reasons were lower throughout.
There were nearly 250 visits related to birth control in 2010, a figure which rose to a peak of 275 by 2012, before a sharp decline to 175 in 2014, and a complete recovery to its starting figure by the end of the time surveyed. In contrast, visits to the doctor concerning eye issuesstarted lower at 125, grew negligibly over the next two years, prior to surging in the final four years to a high point, relative to all visits, of 350.
Diabetic and dental visits were consistently less common with the former beginning at 60, rising steadily to plateau under 100, and finishing the period with a sharp uptick to 175. The latter began the period higher at 100 visits, fell to half that number in 2012, more than recovered to 125 in 2014, and grew marginally in the final two years recorded.
Answers
For extra practice, write an antonym (opposite word) on a piece of paper to help you remember the new vocabulary:
compares shows the differences between
average visitation figures for patients number of times people went to the hospital
clinics hospitals
specific hospital weekly this one medical center each week
In general overall
it is noticeable that it can clearly be seen that
all types of visits except forbirth control all kinds of trips not including pills to stop pregnancy
unchanged overall stable in general
eye issues problems with your eyes
most common over the period happened a lot during that time
overtaking going past
while in contrast
diabetic related to diabetes
dental related to taking care of your teeth
lower throughout less the whole time
nearly almost
related to birth control in concerning pills to prevent pregnancy
figure data
rose to a peak of increased to a high of
before a sharp decline to prior to a big drop to
complete recovery to totally getting back to the same level
starting figure by the end of the time surveyed beginning number at the end of the period
In contrast in comparison
concerning eye issuesstarted lower at having to do with eye problems began under at
grew negligibly over the next two years increased a bit for the next couple of years
prior to surging before increasing a lot
to a high point, relative to its peak, compared to
Diabetic can’t eat too much sugar
dental related to teeth
consistently less common with the former beginning at all the time not as often with the on mentioned before starting at
rising steadily to plateau under increasing consistently to level off at
finishing the period with a sharp uptick to ending the time with a big increase to
latter the one mentioned second
fell to half that number in decreased to 50% of the figure
more than recovered to came back up and exceeded the number before
grew marginally in the final two years recorded increased a bit at the end of the period
I recommend getting a pencil and piece of paper because that aids memory. Then write down the missing vocabulary from my sample answer in your notebook:
The line graph c_________s the a_______________________________s in four categories who went to c______s at a s__________________________y between 2010 and 2016. I___________l, i__________________t the number of patients at the four clinics increased for a______________________________________l which was u_________________l. The figure for e__________s became the m_______________________________d, o__________g birth control, w_____e visits for d________c and d__________l reasons were l______________________t.
There were n________y 250 visits r_________________________n 2010, a f_______e which r_________________f 275 by 2012, b________________________o 175 in 2014, and a c_________________o its s____________________________________________d. I_____________t, visits to the doctor c__________________________________t 125, g______________________________________s, p__________________g in the final four years t______________________t, r_____________o all visits, of 350.
D__________c and d_______l visits were c______________________________________________t 60, r____________________________r 100, and f__________________________________________o 175. The l________r began the period higher at 100 visits, f_____________________________n 2012, m________________________o 125 in 2014, and g_________________________________________d.
Listening Practice
Learn more about this topic by watching from YouTube below and practice with these activities:
These are the most recent/latest IELTS Writing Task 1 Task topics and questions starting in 2019, 2020, 2021, 2022, 2023, 2024, 2025, and continuing into 2026. ...
"The highest quality materials anywhere on the internet! Dave improved my writing and vocabulary so much. Really affordable options you don't want to miss out on!"


0 Comments