This is an IELTS writing task 1 sample answer essay on the topic of a waste collection bar chart.
You can also get my full IELTS EBooks below:
Dave
IELTS Task 1: Waste Collection
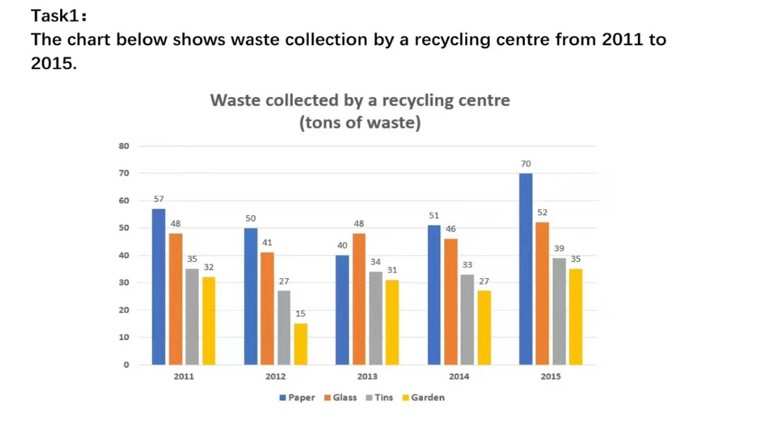
The bar chart compares the figures for waste collection in four categories at a recycling center between 2011 and 2015. Overall, it is noticeable that waste collected for all areas increased, in particular for paper waste which was generally highest throughout the period. In contrast, garden and tin waste were less commonly recycled.
There was a consistent decrease for the amount of paper waste (from 57 tons to 40 tons) from 2011 to 2013, however, the data increased dramatically for the rest of the period and ended at 70 tons. Similarly, in 2011, the figure for glass waste was 48 tons and witnessed a negligible decrease (reaching 41 tons) in 2012. The figure then recovered to its initial number, overtaking the statistic for paper waste in 2013, and fluctuated around 50 tons for the rest of the time surveyed.
The number for tin waste was erratic around 35 tons for the 5-year-period and reached 39 tons in 2015. Garden waste was slightly lower, dropping from 32 tons to 15 tons in 2012, before rebounding to 31 tons the next year and finishing at 35 tons.
Analysis
1. The bar chart compares the figures for waste collection in four categories at a recycling center between 2011 and 2015. 2. Overall, it is noticeable that waste collected for all areas increased, in particular for paper waste which was generally highest throughout the period. 3. In contrast, garden and tin waste were less commonly recycled.
- Paraphrase what the bar chart shows.
- Write a clear overview summarising the differences and the overall trend.
- This one is a little complex so it needs a second sentence for the overview.
1. There was a consistent decrease for the amount of paper waste (from 57 tons to 40 tons) from 2011 to 2013, however, the data increased dramatically for the rest of the period and ended at 70 tons. 2. Similarly, in 2011, the figure for glass waste was 48 tons and witnessed a negligible decrease (reaching 41 tons) in 2012. 3. The figure then recovered to its initial number, overtaking the statistic for paper waste in 2013, and fluctuated around 50 tons for the rest of the time surveyed.
- Begin writing about the data for the first categories.
- Compare between each sentence.
- One paragraph can be longer than the other.
1. The number for tin waste was erratic around 35 tons for the 5-year-period and reached 39 tons in 2015. 2. Garden waste was slightly lower, dropping from 32 tons to 15 tons in 2012, before rebounding to 31 tons the next year and finishing at 35 tons.
- Write about the final other parts of the graph – include everything!
- Compare the categories.
Vocabulary
What do the words in bold below mean? Make some notes on paper to aid memory and then check below.
The bar chart compares the figures for waste collection in four categories at a recycling center between 2011 and 2015. Overall, it is noticeable that waste collected for all areas increased, in particular for paper waste which was generally highest throughout the period. In contrast, garden and tin waste were less commonly recycled.
There was a consistent decrease for the amount of paper waste (from 57 tons to 40 tons) from 2011 to 2013, however, the data increased dramatically for the rest of the period and ended at 70 tons. Similarly, in 2011, the figure for glass waste was 48 tons and witnessed a negligible decrease (reaching 41 tons) in 2012. The figure then recovered to its initial number, overtaking the statistic for paper waste in 2013, and fluctuated around 50 tons for the rest of the time surveyed.
The number for tin waste was erratic around 35 tons for the 5-year-period and reached 39 tons in 2015. Garden waste was slightly lower, dropping from 32 tons to 15 tons in 2012, before rebounding to 31 tons the next year and finishing at 35 tons.
Answers
For extra practice, write an antonym (opposite word) on a piece of paper to help you remember the new vocabulary:
compares shows the differences between
figures for waste collection numbers related to trash taken
recycling center place to recycle trash
Overall, it is noticeable that in general, we can see that
in particular especially
generally highest throughout the period usually the most the whole time
In contrast in comparison to
less commonly recycled not recycled as much
consistent decrease for steady fall for
increased dramatically for the rest of the period and ended at went up a lot for the remainder of the time and finished at
Similarly not different from
witnessed a negligible decrease experienced a small drop
reaching getting to
The figure then recovered to its initial number the number got back to the previous point
overtaking going past
statistic data
fluctuated around was erratic near
for the rest of the time surveyed the remainder of the time detailed
erratic unstable
slightly lower a little less than
dropping from … to … falling from one number to another
before rebounding to prior to recovering to
finishing at ending at
Pronunciation
Practice saying the vocabulary below and use this tip about Google voice search:
kəmˈpeəz
ˈfɪɡəz fɔː weɪst kəˈlɛkʃᵊn
ˌriːˈsaɪklɪŋ ˈsɛntə
ˈəʊvərɔːl, ɪt ɪz ˈnəʊtɪsəbᵊl ðæt
ɪn pəˈtɪkjələ
ˈʤɛnərəli ˈhaɪɪst θruːˈaʊt ðə ˈpɪərɪəd
ɪn ˈkɒntrɑːst
lɛs ˈkɒmənli ˌriːˈsaɪkld
kənˈsɪstənt ˈdiːkriːs fɔː
ɪnˈkriːst drəˈmætɪkᵊli fɔː ðə rɛst ɒv ðə ˈpɪərɪəd ænd ˈɛndɪd æt
ˈsɪmɪləli
ˈwɪtnəst ə ˈnɛɡlɪʤəbᵊl ˈdiːkriːs
ˈriːʧɪŋ
ðə ˈfɪɡə ðɛn rɪˈkʌvəd tuː ɪts ɪˈnɪʃəl ˈnʌmbə
ˌəʊvəˈteɪkɪŋ
stəˈtɪstɪk
ˈflʌkʧueɪtɪd əˈraʊnd
fɔː ðə rɛst ɒv ðə taɪm sɜːˈveɪd
ɪˈrætɪk
ˈslaɪtli ˈləʊə
ˈdrɒpɪŋ frɒm … tuː …
bɪˈfɔː rɪˈbaʊndɪŋ tuː
ˈfɪnɪʃɪŋ æt
Vocabulary Practice
I recommend getting a pencil and piece of paper because that aids memory. Then write down the missing vocabulary from my sample answer in your notebook:
The bar chart c__________s the f_________________n in four categories at a r______________r between 2011 and 2015. O_______________________t waste collected for all areas increased, i____________r for paper waste which was g________________________________d. I_____________t, garden and tin waste were l_____________________d.
There was a c________________________r the amount of paper waste (from 57 tons to 40 tons) from 2011 to 2013, however, the data i_____________________________________________t 70 tons. S__________y, in 2011, the figure for glass waste was 48 tons and w__________________________e (r________g 41 tons) in 2012. T_______________________________________________r, o___________g the s___________c for paper waste in 2013, and f______________________d 50 tons f________________________________d.
The number for tin waste was e________c around 35 tons for the 5-year-period and reached 39 tons in 2015. Garden waste was s____________r, d_______________m 32 tons t___ 15 tons in 2012, b______________________o 31 tons the next year and f_____________t 35 tons.
Listening Practice
Learn more about this topic by watching from YouTube below and practice with these activities:
Reading Practice
Read more about this topic and use these ideas to practice:
https://www.vox.com/down-to-earth/2023/6/7/23743640/plastic-pollution-un-treaty-oceans-waste
Speaking Practice
Practice with the following speaking questions from the real IELTS speaking exam:
Environment
- How are environmental problems dealt with in your country?
- What can be done to make people recycle more often?
- What is the most pressing environmental problem?
- Is recycling a common practice in your country?
- Are governments or individuals more responsible?
Writing Practice
Practice with the related IELTS chart below:


0 Comments