
by Dave | Feb 11, 2018 | Academic, IELTS Writing Task 1, Sample Answers
This is an example of a real question from the exam – keep reading our IELTS sample answer to find out exactly how to deal with bar charts showing time!
The first important thing to notice about this chart isn’t that it is a bar chart. That isn’t very important.
Pay attention to the fact that it is showing change over time, from 2007 to 2009. That means that you have to include the general trend in your overview and include vocabulary like ‘sharp rise’ and ‘precipitous drop’ throughout.
Let’s take a look at the sample answer – then there is some online practice for you to do and an example of good note taking!
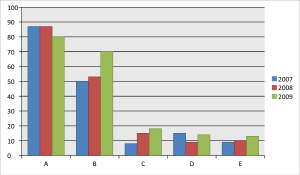
The chart below shows the number of films produced by five countries in three years. Summarise the information by selecting and reporting the main features and make comparisons where relevant.
Sample Answer
The bar chart compares film production in five different countries in the years 2007, 2008 and 2009. Overall, country A produced the most films during the given three-year period followed by country B, while the film industry was not as strong in countries C, D, and E. The largest increase was in country B while country A experienced a small decrease and there were minimal rises in the other nations.
Leading the chart in 2007, country A produced approximately 87 movies and this figure remained unchanged the next year before decreasing to 80 in 2009. On the contrary, a reverse trend was witnessed in B’s film production. Only manufacturing 50 movies in 2007, country B produced 3 more films the next year and about 17 films in 2009, which was the most significant rise among all the countries surveyed.
With substantially lower output, countries C, D, and E were responsible for fewer than 20 movies in each year. Specifically, about 8 films were manufactured in C in the first year, before this figure increased twofold in 2008 and finally reached 18 movies in 2009. Country E also experienced an upward trend, increasing from approximately 9 films to around 12 films by the end of the period. In contrast, country D decreased sharply from around 13 films in 2007 to 8 in 2008 (the lowest number among all countries that year) before recovering to 12 films produced in 2009.
Analysis
Introduction: 1. The bar chart compares film production in five different countries in the years 2007, 2008 and 2009. 2. Overall, country A produced the most films during the given three-year period followed by country B, while the film industry was not as strong in countries C, D, and E. 3. The largest increase was in country B while country A experienced a small decrease and there were minimal rises in the other nations.
1. The first sentence simple paraphrases the topic – don’t spend too much time worrying about this sentence. Write it quickly.
2-3. The second and third sentences are the most important sentence of the whole essay: the general overview. I describe which countries were the biggest/smallest overall and also whether or not each country had an increasing/decreasing trend for the whole period.
Body Paragraph 1: 1. Leading the chart in 2007, country A produced approximately 87 movies and this figure remained unchanged the next year before decreasing to 80 in 2009. 2. On the contrary, a reverse trend was witnessed in B’s film production. 3. Only manufacturing 50 movies in 2007, country B produced 3 more films the next year and about 17 films in 2009, which was the most significant rise among all the countries surveyed.
1. The first sentence describes the figures for the leading country.
2. My second sentence transitions to country B, which was in second place. It’s important to always compare. I compare country B to country C.
3. The third sentence gives the detailed data for country B.
Body Paragraph 2: 1. With substantially lower output, countries C, D, and E were responsible for fewer than 20 movies in each year. 2. Specifically, about 8 films were manufactured in C in the first year, before this figure increased twofold in 2008 and finally reached 18 movies in 2009. 3. Country E also experienced an upward trend, increasing from approximately 9 films to around 12 films by the end of the period. 4. In contrast, country D decreased sharply from around 13 films in 2007 to 8 in 2008 (the lowest number among all countries that year) before recovering to 12 films produced in 2009.
1. The first sentence is a topic sentence that focuses on the three countries with fewer films produced.
2. The second sentence describes the data across the whole period for country C.
3. My third sentence describes the data across the whole period for country E.
4. The fourth sentence describes the data across the whole period for country D.
Vocabulary Practice
Quizlet is an amazing website for helping students to improve their vocabulary and grammar through practice activities (that we designed).
Don’t believe me?
Check it out! We’ve included a set of vocabulary from the sample answer above for you to study.

IELTS sample answer vocabulary practice!
Related Articles and Videos
Example Notes
Here are some notes I made on the vocabulary from the IELTS sample answer (from our Instagram page)!

IELTS Task 1 Writing notes from our Instagram page!

IELTS Task 1 Writing notes from our Instagram page!

IELTS Task 1 Writing notes from our Instagram page!
FINALLY: Here is a BAND 6 STUDENT MODEL ANSWER
Can you find the mistakes in it?
Introduction: The bar chart compares film in five different countries in three years 2007, 2008 and 2009. It is obvious that whereas countries A and D observed a slight decline in film production, a considerable growth in the figure of country C and a marginal rise in B and E were recorded during the period shown.
Body Paragraph 1: A created approximately 87 movies and this figure remained unchanged the next year before decreasing to 80 in 2009. On the contrary, a reverse trend witnessed in B’s film production. Only manufacture 50 movies in 2007, B produced 3 more films in the next year and rose about 17 films in 2009.
Body Paragraph 2: With substantially lower production, countries C, D, and E made less than 20 movies. Specifically, about 8 films manufactured in C in the first year, then reaching 18 in 2009. Likewise, an increase of 4 films from 9 to 13 was in country E. By contrast, country D was with 9 movies 2008 because overall downward trend to 14 movies in 2009.
Answers:
Introduction: The bar chart compares films in five different countries in three years 2007, 2008 and 2009. It is obvious that whereas countries A and D observed a slight decline in film production, a considerable growth in the figure of country C and a marginal rise in B and E were recorded during the period shown. (The overview isn’t good enough to get above Band 6. It clearly gives the main trends but doesn’t include any information ranking which countries produced the most/least.)
Body Paragraph 1: A created produced approximately 87 movies and this figure remained unchanged the next year before decreasing to 80 in 2009. On the contrary, a reverse trend was witnessed in B’s film production. Only manufacturing 50 movies in 2007, B produced 3 more films in the next year and rose to about 17 films in 2009.
Body Paragraph 2: With substantially lower production, countries C, D, and E made less than 20 movies. Specifically, about 8 films were manufactured in C in the first year, then before reaching 18 in 2009. Likewise, an increase of 4 films from 9 to 13 was seen in country E. By contrast, country D was with produced only 9 movies 2008 because and experienced an overall downward trend to 14 movies in 2009.

by Dave | Feb 5, 2018 | Sample Answers
This is an IELTS Sample Answer for Task 2 Writing about cities from January, 2018 – it’s a good question as far as boring IELTS questions go!
There’s nothing really that tricky with this question. The main area my students struggled with was not supporting their main ideas enough in the first paragraph.
Read this sample answer and analysis and complete the vocabulary exercises below it in quizlet.
Check out the links to articles and videos to become more familiar with the topic.
If you want to read another sample answer you can check out this one on businesses.
You can also follow us on our Instagram for early previews of our sample answers.
The recent questions from the IELTS writing task 2 exam are here, task 1 is here and the speaking questions and topics are here.
Dave
Task 2 IELTS Sample Answer
Living in large cities today poses many problems for people.
What are these problems? Should governments encourage more people to live in smaller towns?
More and more people live in cities today than at any point in the past and this trend will likely continue in the future. This has resulted in many problems including extreme overcrowding and governments should take measures to make living outside cities more attractive.
There are a wide range of drawbacks associated with the rise of modern cities but one of the most obvious issues is related to population density. The large number of people crammed into a relatively small area has caused expensive housing, increased traffic and severe pollution. For example, apartment prices in mega-cities like Tokyo and New York have soared to the point where only the wealthiest inhabitants can afford decent living standards. Regardless of financial status, all city dwellers have to deal with more and more traffic jams as the population increases while the area of cities remains fixed. Finally, all these people living and travelling in one place puts a tremendous strain on the environment and some cities, like Beijing in China, have become dangerously polluted.
In my opinion, governments have a duty to encourage citizens to move to more rural areas. If cities continue to expand unabated then the above problems will only get worse. We might one day find ourselves living in densely packed, heavily polluted cities that resemble scenes from a dystopian science fiction film. In order to prevent this from happening, the government can give tax breaks to companies that choose to locate offices and production facilities outside the city. This will provide more jobs for people who are willing to live in the countryside.
In conclusion, the concerns related to overcrowding in cities can and should be somewhat countered by governments incentivising living in rural areas. If this is done then we may still face problems related to cities in the future, but at least they will not be as serious.
Analysis
Introduction: 1. More and more people live in cities today than at any point in the past and this trend will likely continue in the future. 2. This has resulted in many problems including extreme overcrowding and governments should take measures to make living outside cities more attractive.
1. The first sentence simply restates what the general topic is – expanding cities.
2. The second sentence gives my opinion about what the main problem with this is and my opinion that governments should encourage people to live outside cities.
Body Paragraph 1: 1. There are a wide range of drawbacks associated with the rise of modern cities but one of the most obvious issues is related to population density. 2. The large number of people crammed into a relatively small area has caused expensive housing, increased traffic and severe pollution. 3. For example, apartment prices in mega-cities like Tokyo and New York have soared to the point where only the wealthiest inhabitants can afford decent living standards. 4. Regardless of financial status, all city dwellers have to deal with more and more traffic jams as the population increases while the area of cities remains fixed. 5. Finally, all these people living and travelling in one place puts a tremendous strain on the environment and some cities, like Beijing in China, have become dangerously polluted.
1. The first sentence is a topic sentence that includes my main idea for the whole paragraph (the main problem is population density / overcrowding).
2. The second sentence expands my main idea by saying that overcrowding has caused other problems related to housing, traffic and pollution. I must describe all three of these issues in order to effectively support my topic sentence.
3. The third sentence explains the first problem – expensive housing.
4. The fourth sentence explains the second problem – traffic jams.
5. The fifth sentence explains the third problem – pollution.
Body Paragraph 2: 1. In my opinion, governments have a duty to encourage citizens to move to more rural areas. 2. If cities continue to expand unabated then the above problems will only get worse. 3. We might one day find ourselves living in densely packed, heavily polluted cities that resemble scenes from a dystopian science fiction film. 4. In order to prevent this from happening, the government can give tax breaks to companies that choose to locate offices and production facilities outside the city. 5. This will provide more jobs for people who are willing to live in the countryside.
1. The first sentence is a topic sentence that includes my main idea for the whole paragraph (governments should encourage people to live in rural areas).
2. The second sentence supports my opinion by saying that problems in cities are only getting worse.
3. The third sentence further supports my opinion by saying how terrible life in cities may someday get. It’s important to say ‘might’ because I don’t want to make an argument that is too strong in a short essay.
4. The fourth sentence suggests governments have the power to do this by giving corporations tax breaks.
5. The fifth and final sentence extends my solution by saying that more people will move to the countryside if jobs are available there.
Conclusion: 1. In conclusion, the concerns related to overcrowding in cities can and should be somewhat countered by governments incentivising living in rural areas. 2. If this is done then we may still face problems related to cities in the future, but at least they will not be as serious.
1. The first sentence restates the main ideas from the sample answer as well as my overall opinion. Make sure you have an overall opinion because the question directly asks you whether or not governments should encourage people to live outside cities.
2. The second sentence adds an extra detail (claiming that by doing this inevitable future problems related to cities will not be as severe) that is needed to get above a Band 7 for Task Achievement according to some, but not all, examiners.
Vocabulary Practice
I really love this website – Quizlet – because it’s so convenient to practice with!
Don’t believe me? Click on the link below and use it to easily learn some high-level vocabulary from the sample answer above:

Study the vocabulary from our IELTS sample answer on cities!
Cities Articles
Cities Videos
Example Notes
Here are some notes I made about cities (on my Instagram page)!
Now it’s Your Turn! Comment below on our IELTS Sample Answer:
Tell us about your city! Is it big? What kind of problems are there? Do you live in a small town?

by Dave | Jan 30, 2018 | How To
I recently wrote a post about how to analyse tables and it was so popular that I decided to do the same for pie charts, which lots of student also find very difficult to analyse.
So, again I will show you how to make simple notes, that will make analysing pie charts easier, helping you to recognise (see) and remember all of the important trends.
Dave
Why Pie Charts are Difficult
It’s no surprise that students struggle with pie charts. After all, it is much easier to see the overall trend in a line chart or a bar graph than in a pie chart.
In a pie chart you are looking at two or three specific time points so you have to look carefully to identify (find) the trends.
And the chart in the real exam is ALWAYS in black and white, which makes it more difficult to see the trends and make comparisons quickly.
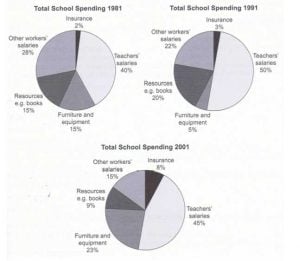
First you need to know what you are looking at. For the chart below, taken from a previous IELTS exam (Cambridge 8), you are looking at the same kind of data (total school spending), divided into five fields in three different years.
Make Notes about Figures
In the charts below you can see I’ve followed the charts for each of the five fields from 1981 via
(through) 1991 to 2001, and drawn an arrow to show the overall trends and calculated the overall changes.
For example, Insurance went from 2% to 3% to 8% so that is a clear upward trend, so I made a note on the final pie chart of x4 (four times), and I drew a straight upward arrow to show a clear large increase.
In contrast, Teachers’ salaries initially went up from 40% to 50% before falling to 45%, so it was an overall increase of 5% (or about 10% of the original 40%).
So I made a note on the final pie chart of +10% and I drew a fluctuating arrow but with a clear increase overall.

Make Notes about Positions
Next, in the chart below you can see I noted all the positions in the first and last years so I can clearly see any changes overall.
For example, in 1999 Other workers’ salaries was the 2nd largest area of school spending, whereas in 2001 it had dropped to the 3rd largest area.
So I wrote 2 and 3 next to that part of the pie chart for 2001, and I drew with an arrow to show the direction of the change.

Select, Group and Compare
Now you can see the trends easily, all you need to do is recognise any general patterns and identify which are the most important trends.
For example, it is now clear that three areas experienced an upward trend, whereas two areas had a downward trend.
It is also clear that according to the three charts, Teachers’ salaries remained the largest area of spending throughout the twenty year period.
In contrast, the percentage of money spent on Furniture and equipment became the second largest area of spending, overtaking Other workers’ salaries.
For a band 7+ you should be making comparisons where possible.
So you could note that by the end of the period twice as much is spent on Teachers’ Salaries compared to Furniture and equipment.
Furthermore you could note that by 2001 three times as much is spent on Teachers’ Salaries compared to Other workers’ salaries.
Now it’s your turn! Put your answers in the comments.
Look again at the charts. What other trends can you see?
Write some example sentences like mine.

by Dave | Jan 29, 2018 | How To
Which kind of Task 1 Writing questions are the most difficult? In my experience as an IELTS Teacher and Examiner, most students say it’s tables!
In this article I show you how to make simple notes on the table, so that it will be easier to recognise (see) and remember all of the important trends.
Dave
Tables are Challenging
It’s no surprise that students struggle with tables. After all, it is much easier to see the overall trends in a line chart or a bar graph.
But in a table you are just looking at the naked data. Just look at the example below taken from a previous IELTS writing exam (taken from Cambridge 10).
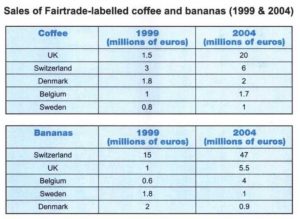
There are a lot of figures to process and it’s practically (nearly) impossible to see the trends quickly and then remember them as you are writing your report.
So what you need to do is make notes on the table about all the important changes. For the table above you need to note changes in sales and also changes in position.
Let’s look at changes in sales first.
Make Notes about Figures
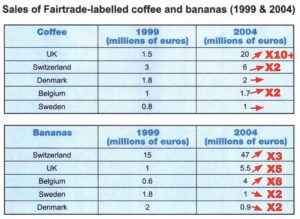
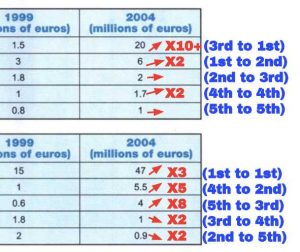
In the table below you can see I’ve roughly calculated the changes in sales of coffee and bananas for each country between 1999 and 2004, and I’ve made notes at the side of the most recent figures.
For example, in the UK the amount of coffee sold increased by more than 10 times so I’ve made a note of that as x10+, and I drew an arrow to show a large increase.
Similarly, for Sweden it increased by a very small amount (compared to other countries) so I only drew an arrow to show a very slight increase and no figure.
Make Notes about Positions
Next, in the table below you can see I noted all the positions for both time periods so I can clearly see any changes.
For example, in 1999 the UK sold the 3rd largest amount of coffee, whereas in 2004 it sold the most amount of coffee.
So I wrote 3 and 1 in the columns for 1999 and 2004 respectively, and I drew with an arrow to show the direction of the change.
By the way, it is now easy to spot (see) that the order of the country names for both Coffee and Bananas matches their positions in 2004.
Group, Select and Compare Trends
Now you can see the trends easily, what you need to do next is recognise any general patterns and identify (decide) which are the most important trends.
For example, it is now clear that sales of coffee in all five countries experienced (had) an upward trend, whereas for Bananas two of the the three countries saw a downward trend.
Similarly, it is clear that the leading seller of coffee changed from Switzerland to the UK, going from 3rd to 1st and increasing by over 10 times.
In contrast Switzerland remained the top seller of Bananas and increased their share by 3 times.
For a band 7+ you should notice important comparisons if possible.
So you could note that the UK ended up selling four times as much coffee as Switzerland in 2004.
You could also note that Switzerland ended up selling nearly five times as many Bananas as the UK in 2004.
Now it’s your turn! Put your answers in the comments.
Look again at the table. What other trends can you see?
Write some example sentences like mine.

by Dave | Jan 28, 2018 | Sample Answers
This is an IELTS Sample Answer for Task 2 Writing from the test on January 20th, 2018 in the Asia region (different regions have different tests to prevent cheating).
It was a little bit tricky because of one strange part of the question but overall not the most difficult Task 2 Writing I’ve seen.
Read this sample answer and analysis and complete the vocabulary exercises below it in quizlet.
Check out the links to articles and videos to become more familiar with the topic. It’s really important to have some experience with a wide range of topics for all parts of the test.
If you want to read another sample answer you can check out this one on climate change.
For sample speaking questions and tips from the test check out our YouTube Channel.
Dave
Task 2 IELTS Sample Question
Recent research has shown that business meetings and training are increasingly taking place online.
What are the advantages and disadvantages of this?
Sample Answer
Many businesses today choose to hold meetings and do training online, rather than in person. While this has certain drawbacks related to interpersonal relationships, I still feel this is a positive trend because of its positive impact on employees with families. In this essay, I will discuss both sides in detail.
Conducting the majority of business meetings online has a potentially negative effect on the social dynamics of a company. The preference for online communication sacrifices essential elements of human interaction in the name of a more efficient, utilitarian process. When people sit in a room together, for training or a meeting, they are more likely to form strong interpersonal bonds. They will be able to see each other’s body language better and there is a good chance they may socialise in person afterwards. For example, employees might go for drinks or even just have a private chat about the meeting or training while still at work. This is much less likely to happen when people are working from home or a remote location and using online tools like Skype to communicate.
Companies that choose to do more training and have more meetings online are making life more convenient for their employees with families. At some point in their lives, most people must face the challenge of working and having a family. If both the mother and father work, then one of them might have to give up their job to stay home or they will have to hire an expensive caretaker to look after their child during the day. If more meetings and training took place online, this could free up time for people in certain jobs, such as IT workers, to work entirely from home and look after their children during the day. They will still have to make time for the training and meetings but at least they won’t waste valuable time commuting to the office.
The move towards increased online training and meetings may sacrifice some of the social aspects of work but this is more than made up for by the convenience it allows working families. In many families today, both the mother and father have to work to make ends meet and we should support any efforts to relieve their financial and physical burdens.
Analysis
Introduction: 1. Many businesses today choose to hold meetings and do training online, rather than in person. 2. While this has certain drawbacks related to interpersonal relationships, I still feel this is a positive trend because of its positive impact on employees with families. 3. In this essay, I will discuss both sides in detail.
1. The trickiest part of this question is the mention of ‘business meetings and training.’ You have to make your answer general enough to include both of those slightly different situations but also specific enough to have well-supported and relevant main ideas. I have done this by mentioning training and meetings a few times throughout the answer.
2. The first sentence simply restates the topic. Don’t waste much time on this sentence – write it simply and quickly.
3. The second sentence clearly states my opinion, which is necessary to get at least a Band 6 for Task Achievement.
4. The third sentence simply states that I will talk about both sides. This sentence is not very important – write it quickly so you can focus on the main body paragraphs.
Body Paragraph 1: 1. Conducting the majority of business meetings online has a potentially negative effect on the social dynamics of a company. 2. The preference for online communication sacrifices essential elements of human interaction in the name of a more efficient, utilitarian process. 3. When people sit in a room together, for training or a meeting, they are more likely to form strong interpersonal bonds. 4. They will be able to see each other’s body language better and there is a good chance they may socialise in person afterwards. 5. For example, employees might go for drinks or even just have a private chat about the meeting or training while still at work. 6. This is much less likely to happen when people are working from home or a remote location and using online tools like Skype to communicate.
1. The first sentence is a topic sentence that includes my main idea for the whole paragraph (online meetings and training has negative effect on how well people get along). It is key to include both training and meetings, but not talk specifically about one or the other, just to be safe.
2. The second sentence extends my main idea by pointing out that even though companies may become more efficient, they will be less ‘human.’
3. The third sentence further supports my main idea by claiming that people meeting physically form stronger bonds.
4. The fourth sentence supports this idea by saying that body language and socialising are important parts of interpersonal relationships.
5. The fifth sentence gives the example of colleagues going out for a drink or chatting after a meeting.
6. The sixth and final sentence claims that online communication will (likely) prevent this from happening.
Body Paragraph 2: 1. Companies that choose to do more training and have more meetings online are making life more convenient for their employees with families. 2. At some point in their lives, most people must face the challenge of working and having a family. 3. If both the mother and father work, then one of them might have to give up their job to stay home or they will have to hire an expensive caretaker to look after their child during the day. 4. If more meetings and training took place online, this could free up time for people in certain jobs, such as IT workers, to work entirely from home and look after their children during the day. 5. They will still have to make time for the training and meetings but at least they won’t waste valuable time commuting to the office.
1. The first sentence is a topic sentence that includes my main idea for the whole paragraph (online training and meetings are more convenient for employees with families).
2. The second sentence further supports my main idea by pointing out that most people have to juggle family and work life.
3. The third sentence further supports my main idea by giving the example of working parents who might have to give up their job or hire a caretaker.
4. The fourth sentence develops this example by saying that online meetings might free up certain occupations to work entirely from home.
5. The fifth and final sentence extends this by including the detail that even though they will still have to do the online meetings and training they will save time on commuting.
Conclusion: 1. The move towards increased online training and meetings may sacrifice some of the social aspects of work but this is more than made up for by the convenience it allows working families. 2. In many families today, both the mother and father have to work to make ends meet and we should support any efforts to relieve their financial and physical burdens.
1. The first sentence restates the main ideas from the sample answer as well as my overall opinion. Make sure you have an overall opinion.
2. The second sentence adds an extra detail (stating how important it is to support working parents) that is needed to get above a Band 7 for Task Achievement according to some, but not all, examiners.
Vocabulary Practice
Quizlet is one of the best websites on the internet that you are not using (unless if you are using it – then good!)
Don’t believe me? Click on the link below and use it to easily learn some high-level vocabulary from the sample answer above:

Practice the vocabulary from this IELTS Sample Answer here!
Business / Working from Home Articles
Business / Working from Home Videos
Example Notes
Here are some notes I made on the vocabulary from the IELTS sample answer (from our Instagram page)!

Our IELTS Sample Answer notes!
Now it’s Your Turn! Comment below on our IELTS Sample Answer:
Is it a good idea for businesses to do training online? To hold meetings online? How much time do you waste in meetings every week?
