This is an IELTS writing task 1 sample answer essay on the topic of distances travelled in the UK for 5 different kinds of transport from the real IELTS exam.
Please consider supporting my efforts to creative high quality IELTS materials for students around the world by signing up for my Patreon (and so you won’t miss out on any of my exclusive IELTS Ebooks)!
Dave
IELTS Essay Task 1: Distances Travelled Bar Chart
The chart illustrates distances traveled per person per week (in kilometers) in terms of 5 types of transport in the UK between 1990 and 2000.
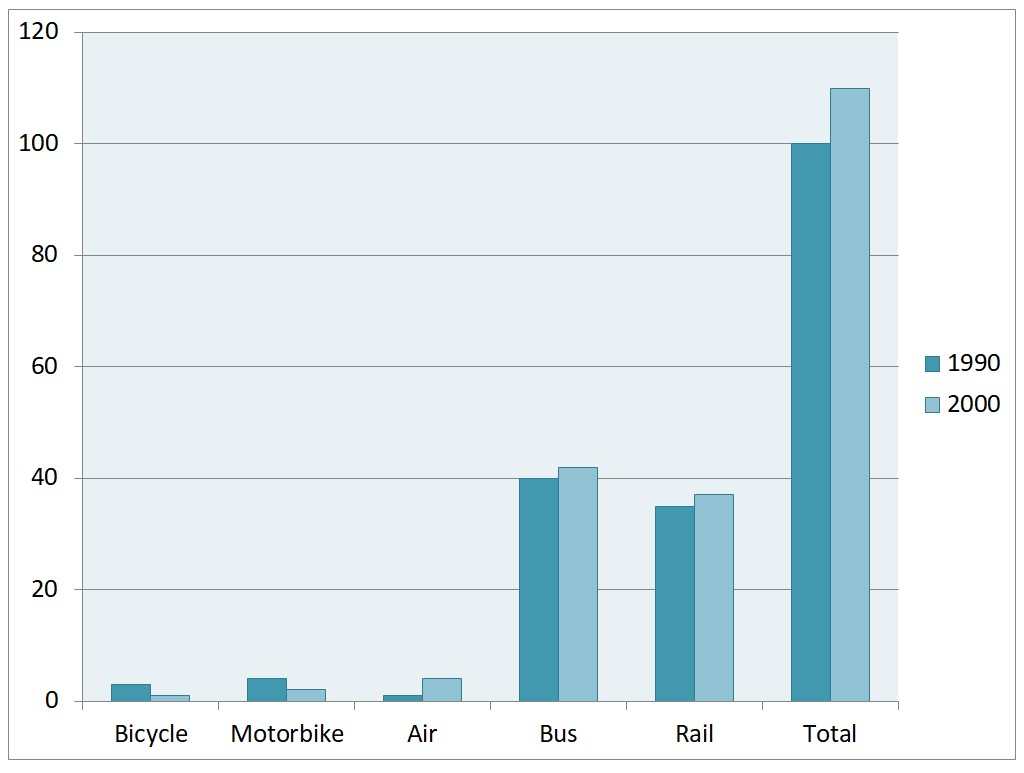
The bar chart details the changes in travel habits by mode of transport in 1990 and 2000 in the UK. Looking from an overall perspective, it is readily apparent that the rise in total figures over the period was a result of increases from rail, bus and air as bicycle and motorbike usage fell. The most common forms of travel were by far bus and rail.
Looking first of all at the two leaders, busing accounted for precisely 40 kilometres in 1990, before a small increase to 42 by 2000. Rail was lower in both periods at 36 and 38 km, respectively.
The less used modes of transport were all below 5 km a week. Bicycles started at 2 and fell to 1 km while motorbikes halved from 4 to 2 km. Finally, air in 1990 was just above 1 but had quadrupled to 4 km per month per person by 2000.
Overall totals constituted 100 km in 1990 and a subsequent 110 by the end of the period surveyed.
Analysis
1. The bar chart details the changes in travel habits by mode of transport in 1990 and 2000 in the UK. 2. Looking from an overall perspective, it is readily apparent that the rise in total figures over the period was a result of increases from rail, bus and air as bicycle and motorbike usage fell. 3. The most common forms of travel were by far bus and rail.
- Paraphrase what the graph shows.
- Write a clear overview summarising the major trends and differences.
- Add an extra sentence to be sure that you have covered everything.
1. Looking first of all at the two leaders, busing accounted for precisely 40 kilometres in 1990, before a small increase to 42 by 2000. 2. Rail was lower in both periods at 36 and 38 km, respectively.
- Begin writing about the differences.
- Compare as much as possible.
1. The less used modes of transport were all below 5 km a week. 2. Bicycles started at 2 and fell to 1 km while motorbikes halved from 4 to 2 km. 3. Finally, air in 1990 was just above 1 but had quadrupled to 4 km per month per person by 2000.
- Write about the rest of the information.
- Make sure you have detailed all the information.
- Don’t leave anything out!
1. Overall totals constituted 100 km in 1990 and a subsequent 110 by the end of the period surveyed.
- The total is also important to mention.
Vocabulary
What do the words in bold below mean? Take some notes on a piece of paper to aid your memory:
The bar chart details the changes in travel habits by mode of transport in 1990 and 2000 in the UK. Looking from an overall perspective, it is readily apparent that the rise in total figures over the period was a result of increases from rail, bus and air as bicycle and motorbike usage fell. The most common forms of travel were by far bus and rail.
Looking first of all at the two leaders, busing accounted for precisely 40 kilometres in 1990, before a small increase to 42 by 2000. Rail was lower in both periods at 36 and 38 km, respectively.
The less used modes of transport were all below 5 km a week. Bicycles started at 2 and fell to 1 km while motorbikes halved from 4 to 2 km. Finally, air in 1990 was just above 1 but had quadrupled to 4 km per month per person by 2000.
Overall totals constituted 100 km in 1990 and a subsequent 110 by the end of the period surveyed.
Answers
details describes
travel habits the way people get around
transport bikes, cars, etc.
Looking from an overall perspective, it is readily apparent that overall
rise increase
total figures overall numbers
a result of comes from
rail railroads/trains
air flights/airplanes
usage fell amount they were used declined
common forms well known ways
by far by a lot
looking first of all at considering to begin
accounted constituted
precisely exactly
before prior to
lower under
periods times
respectively in turn
less used modes of transport not as common ways of getting around
below under
started began
halved cut in half
per month per person each month for each person
overall totals final numbers
constituted made up
subsequent after that
by the end of the period surveyed at the end of the time recorded
Pronunciation
ˈdiːteɪlz
ˈtrævl ˈhæbɪts
ˈtrænspɔːt
ˈlʊkɪŋ frɒm ən ˈəʊvərɔːl pəˈspɛktɪv, ɪt ɪz ˈrɛdɪli əˈpærənt ðæt
raɪz
ˈtəʊtl ˈfɪgəz
ə rɪˈzʌlt ɒv
reɪl
eə
ˈjuːzɪʤ fɛl
ˈkɒmən fɔːmz
baɪ fɑː
ˈlʊkɪŋ fɜːst ɒv ɔːl æt
əˈkaʊntɪd
prɪˈsaɪsli
bɪˈfɔː
ˈləʊə
ˈpɪərɪədz
rɪsˈpɛktɪvli
lɛs juːzd məʊdz ɒv ˈtrænspɔːt
bɪˈləʊ
ˈstɑːtɪd
hɑːvd
pɜː mʌnθ pɜː ˈpɜːsn
ˈəʊvərɔːl ˈtəʊtlz
ˈkɒnstɪtjuːtɪd
ˈsʌbsɪkwənt
baɪ ði ɛnd ɒv ðə ˈpɪərɪəd sɜːˈveɪd
Vocabulary Practice
Remember and fill in the blanks:
The bar chart d________s the changes in t______________s by mode of t__________t in 1990 and 2000 in the UK. L____________________________________________t the r___e in t______________s over the period was a____________f increases from r_____l, bus and a___r as bicycle and motorbike u__________l. The most c______________s of travel were b_____r bus and rail.
L____________________t the two leaders, busing a____________d for p__________y 40 kilometres in 1990, b________e a small increase to 42 by 2000. Rail was l_____r in both p______s at 36 and 38 km, r_____________y.
The l_________________________t were all b______w 5 km a week. Bicycles s___________d at 2 and fell to 1 km while motorbikes h________d from 4 to 2 km. Finally, air in 1990 was just above 1 but had quadrupled to 4 km p_______________________n by 2000.
O______________s c____________d 100 km in 1990 and a s____________t 110 b____________________________d.
Listening Practice
Listen to the related topic below and practice with these activities:
Reading Practice
Read more and use these ideas to practice:
https://www.bbc.co.uk/news/av/business-52670597
Speaking Practice
Practice with the following related questions from the real IELTS speaking exam:
Public Transport (Model answer available on my Patreon)
- Does your city use a lot of public transport?
- When was the last time you used public transport?
- Will you still use public transport in the future?
- What would you like to change about the public transport in your city?
Writing Practice
Practice with the related graph below related to film production in 5 countries and then check with my sample answer:


i’m a little bit confused, where did you get the 36, 38, 4, 2 number from?
You can’t see the exact number so you can estimate what they are – that is fine on IELTS.
The bar chart compares the distances that average people traveled each week on bicycles, motobikes, planes, buses, and trains in the UK from 1990 to 2000.
It is clear that the total travel distance in all transport in 2000 is higher than in 1990. In ten years, the distances people travel by bus and train are the majority, but the distances people travel by bicycle, motorbikes and planes are much shorter.
We can see rise distances in planes, buses, and trains over decade. Sepecifically, the increasing distance in planes is so significant that the average distance in 2000 is nearly 3 times longer than that in 1990. However, the average distances traveled by bicycles and motorcycles are reduced by three and a half times, respectively.
In these ten years, buses and trains are still the two longest distance transportation options, which are about 40 km per week. Meanwhile, bicycles, motorbikess, and planes show the shorter distance. The shortest distance transport was by plane in 1990, and it became by bicycle in 2000.
Nice, Gakki!
Don’t use ‘we’ in task 1 writing or the word ‘meanwhile’.
band ??
Always band 9 for mine!
The bar chart compares the travelling distances made by a person in a week in UK from 1990 till 2000, using 5 different transport categories: bicycle, motorbike, air, bus and rail. The distance is measured in kilometers.
Looking from an overall perspective it is readily apparent that consumption of transports increased by the year 2000. The air raised to higher position in 2000 from the lowest in 1990, the inverse was true for bicycle ranking the lowest in 2000.
With regards to the bus transportation it remained the leading from the year 1990 with 40 km count till 43km in 2000, followed by rail with modest increase from 36km till 38km, greatly outstripping air, which rose slightly from 1km distance till 5km.
The final two transports , bicycle and motorbike, experienced similarly dramatic decline, Bicycle’s kilometer range was about 4 in 1990 and the motorbike was slightly higher at around 5 km. Both transports lost about 2 kilometers with the former finishing at around 2 km and latter modestly higher at 3km.
Great inclusion of the data! The overview is too specific though…