This is an IELTS writing task 1 sample answer essay on the topic of expenditure.
You can also get my full IELTS EBooks below:
Dave
IELTS Essay: Expenditure Bar Chart

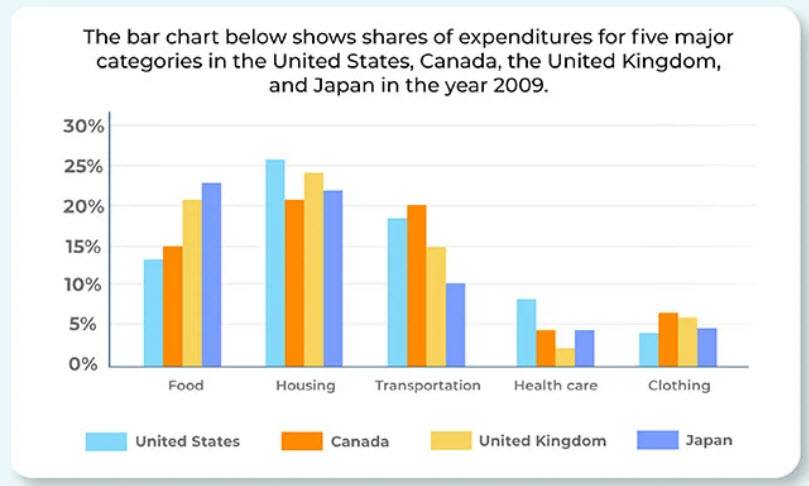
The bar chart describes spending in five lifestyle categories for residents of four different nations in 2009. Looking from an overall perspective, it is readily apparent that housing, food, and transportation are the biggest expenses in nearly all countries, with those in the United States spending the most on their homes and those in Japan the most on food. Healthcare and clothing are smaller expenses and transportation is a greater expenditure than food in only Canada and the US.
Expenditure on food ranges from a low of 14% in the United States to a high of 22% for Japan, with Canada (15%) and the UK (21%) in between. Housing costs represented at least a slightly higher percentage in all countries: 26% in the US, 24% in the UK, 21% in Japan, and 20% in Canada. The numbers were more variable for transportation as Canada stood at 20%, just above the USA at 19% while the UK and Japan were lower at 15% and 10%, respectively.
In terms of healthcare, by far the most is allocated for medical expenses in the USA (8%) while all other countries are below 5%. For clothing, Canada spends the most of their income (7%), followed by the UK (6%), Japan (4%), and finally the United States (3%).
Analysis
1. The bar chart describes spending in five lifestyle categories for residents of four different nations in 2009. 2. Looking from an overall perspective, it is readily apparent that housing, food, and transportation are the biggest expenses in nearly all countries, with those in the United States spending the most on their homes and those in Japan the most on food. 3. Healthcare and clothing are smaller expenses and transportation is a greater expenditure than food in only Canada and the US.
- Paraphrase what the bar chart shows.
- Write a clear overview summarising the differences and the overall trend.
- This one is a little complex so it needs a second sentence for the overview.
1. Expenditure on food ranges from a low of 14% in the United States to a high of 22% for Japan, with Canada (15%) and the UK (21%) in between. 2. Housing costs represented at least a slightly higher percentage in all countries: 26% in the US, 24% in the UK, 21% in Japan, and 20% in Canada. 3. The numbers were more variable for transportation as Canada stood at 20%, just above the USA at 19% while the UK and Japan were lower at 15% and 10%, respectively.
- Begin writing about the data for the first categories.
- Compare between each sentence.
- One paragraph can be longer than the other.
1. In terms of healthcare, by far the most is allocated for medical expenses in the USA (8%) while all other countries are below 5%. 2. For clothing, Canada spends the most of their income (7%), followed by the UK (6%), Japan (4%), and finally the United States (3%).
- Write about the final other parts of the graph – include everything!
- Compare the categories.
- Add as much detail as possible.
- Keep comparing…
- This one is a bit long, but better than being too short!
Vocabulary
The bar chart describes spending in five lifestyle categories for residents of four different nations in 2009. Looking from an overall perspective, it is readily apparent that housing, food, and transportation are the biggest expenses in nearly all countries, with those in the United States spending the most on their homes and those in Japan the most on food. Healthcare and clothing are smaller expenses and transportation is a greater expenditure than food in only Canada and the US.
Expenditure on food ranges from a low of 14% in the United States to a high of 22% for Japan, with Canada (15%) and the UK (21%) in between. Housing costs represented at least a slightly higher percentage in all countries: 26% in the US, 24% in the UK, 21% in Japan, and 20% in Canada. The numbers were more variable for transportation as Canada stood at 20%, just above the USA at 19% while the UK and Japan were lower at 15% and 10%, respectively.
In terms of healthcare, by far the most is allocated for medical expenses in the USA (8%) while all other countries are below 5%. For clothing, Canada spends the most of their income (7%), followed by the UK (6%), Japan (4%), and finally the United States (3%).
Answers
For extra practice, write an antonym (opposite word) on a piece of paper to help you remember the new vocabulary:
describes spending shows how much money is used
categories areas
residents people living there
Looking from an overall perspective, it is readily apparent that overall
biggest expenses what is spent on the most
nearly almost
Healthcare hospitals, doctors, etc.
greater expenditure than more spent on
ranges from a low of goes from … to …
a high of the most at
in between in the middle
represented at least a slightly higher percentage was a little bit more
variable is more different
stood at was at
just above slightly over
while in contrast
lower less than
respectively for each
In terms of concerning
by far a lot more
allocated given to that / for each
medical expenses healthcare
income money earned
followed by after that
finally lastly
Pronunciation
Practice saying the vocabulary below and use this tip about Google voice search:
dɪsˈkraɪbz ˈspɛndɪŋ
ˈkætɪɡəriz
ˈrɛzɪdənts
ˈlʊkɪŋ frɒm ən ˈəʊvərɔːl pəˈspɛktɪv, ɪt ɪz ˈrɛdɪli əˈpærənt ðæt
ˈbɪɡɪst ɪksˈpɛnsɪz
ˈnɪəli
ˈhɛlθkeə
ˈɡreɪtər ɪksˈpɛndɪʧə ðæn
ˈreɪnʤɪz frɒm ə ləʊ ɒv
ə haɪ ɒv
ɪn bɪˈtwiːn
ˌrɛprɪˈzɛntɪd æt liːst ə ˈslaɪtli ˈhaɪə pəˈsɛntɪʤ
ˈveərɪəbᵊl
stʊd æt
ʤʌst əˈbʌv
waɪl
ˈləʊə
rɪsˈpɛktɪvli
ɪn tɜːmz ɒv
baɪ fɑː
ˈæləʊkeɪtɪd
ˈmɛdɪkəl ɪksˈpɛnsɪz
ˈɪnkʌm
ˈfɒləʊd baɪ
ˈfaɪnəli
Vocabulary Practice
The bar chart d__________________g in five lifestyle c___________s for r____________s of four different nations in 2009. L__________________________________________________________________________t housing, food, and transportation are the b______________s in n________y all countries, with those in the United States spending the most on their homes and those in Japan the most on food. H_____________e and clothing are smaller expenses and transportation is a g_________________________n food in only Canada and the US.
Expenditure on food r____________________f 14% in the United States to a_________f 22% for Japan, with Canada (15%) and the UK (21%) i____________n. Housing costs r_______________________________________e in all countries: 26% in the US, 24% in the UK, 21% in Japan, and 20% in Canada. The numbers were more v________e for transportation as Canada s________t 20%, j_________e the USA at 19% w_____e the UK and Japan were l_______r at 15% and 10%, r____________y.
I_______________f healthcare, b_______r the most is a_________d for m______________s in the USA (8%) while all other countries are below 5%. For clothing, Canada spends the most of their i___________e (7%), f___________y the UK (6%), Japan (4%), and f_________y the United States (3%).
Listening Practice
Reading Practice
https://nypost.com/2023/03/30/how-we-know-the-super-rich-are-finally-clamping-down-on-spending/
Speaking Practice
Shopping
- What do you usually shop for?
- Do you often go to malls?
- Do you shop online a lot?
- How common are shopping centers in your country?


The essay is really great how did you come up with such beaitiful grammar structures?
“Housing costs represented at least a slightly higher percentage in all countries: 26% in the US, 24% in the UK, 21% in Japan, and 20% in Canada”
Hi Dave! Isn’t Japan’s housing figure lower than food?