This is an IELTS writing task 1 sample answer essay on the topic of an ownership of electrical appliances line chart from IELTS Cambridge 16.
You can access the complete guide to Cambridge IELTS 16 here along with sample answers.
Please consider supporting my efforts to creative high quality IELTS materials for students around the world by signing up for my Patreon (and so you won’t miss out on any of my exclusive IELTS Ebooks)!
Dave
IELTS 16 Essay: Ownership of Electrical Appliances Line Chart
The charts below show the changes in ownership of electrical appliances and amount of time spent doing housework in households in one country between 1920 and 2019.
Summarise the information by selecting and reporting the main features, and make comparisons where relevant.
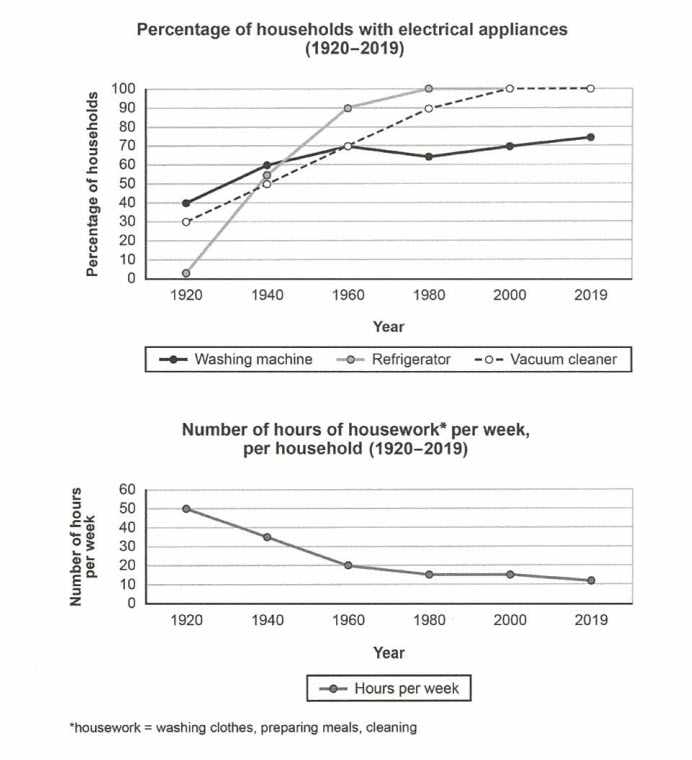
The line charts detail total percentages of electrical appliances in a given country from 1920 to 2019 and the results on housework undertaken per week. Looking from an overall perspective, it is readily apparent that all electrical appliances became more popular, in particular refrigerators and vacuum cleaners. The total time spent doing housework has also declined steadily and dramatically in the last one hundred years.
Refrigerators witnessed the most significant rise, beginning at just over 0% in 1920, surging to more than 50% by 1950, and then continuing to rise steadily until plateauing at 100% around 1980. Vacuum cleaners started higher at 30% and then rose by precisely 20% every 20 years until 1960 when growth tapered and ownership ultimately reached 100% by 1980. In contrast, proportions for washing machines began at 40%, climbed to 70% by 1960, then fell slightly, and recovered to finish the period at just above 70%.
The result for housework was that time spent washing clothes, preparing meals, and cleaning fell steadily from 50 hours a week in 1920 to 20 by 1960. After that, the decline was more gradual, reaching slightly above 10 hours by 2019.
Analysis
1. The line charts detail total percentages of electrical appliances in a given country from 1920 to 2019 and the results on housework undertaken per week. 2. Looking from an overall perspective, it is readily apparent that all electrical appliances became more popular, in particular refrigerators and vacuum cleaners. 3. The total time spent doing housework has also declined steadily and dramatically in the last one hundred years.
- Paraphrase what the process shows.
- Write a clear overview summarising the major groups. Read here about overviews for processes.
- You might need a second sentence for your overview.
1. Refrigerators witnessed the most significant rise, beginning at just over 0% in 1920, surging to more than 50% by 1950, and then continuing to rise steadily until plateauing at 100% around 1980. 2. Vacuum cleaners started higher at 30% and then rose by precisely 20% every 20 years until 1960 when growth tapered and ownership ultimately reached 100% by 1980. 3. In contrast, proportions for washing machines began at 40%, climbed to 70% by 1960, then fell slightly, and recovered to finish the period at just above 70%.
- Begin writing about the data for the first category.
- Describe the next area and compare it to the area before.
- Make sure everything is detailed.
1. The result for housework was that time spent washing clothes, preparing meals, and cleaning fell steadily from 50 hours a week in 1920 to 20 by 1960. 2. After that, the decline was more gradual, reaching slightly above 10 hours by 2019.
- Write about the final line chart – include everything!
- Try to paraphrase some words used before as well.
Vocabulary
What do the words in bold below mean? Take some notes on a piece of paper to aid your memory:
The line charts detail total percentages of electrical appliances in a given country from 1920 to 2019 and the results on housework undertaken per week. Looking from an overall perspective, it is readily apparent that all electrical appliances became more popular, in particular refrigerators and vacuum cleaners. The total time spent doing housework has also declined steadily and dramatically in the last one hundred years.
Refrigerators witnessed the most significant rise, beginning at just over 0% in 1920, surging to more than 50% by 1950, and then continuing to rise steadily until plateauing at 100% around 1980. Vacuum cleaners started higher at 30% and then rose by precisely 20% every 20 years until 1960 when growth tapered and ownership ultimately reached 100% by 1980. In contrast, proportions for washing machines began at 40%, climbed to 70% by 1960, then fell slightly, and recovered to finish the period at just above 70%.
The result for housework was that time spent washing clothes, preparing meals, and cleaning fell steadily from 50 hours a week in 1920 to 20 by 1960. After that, the decline was more gradual, reaching slightly above 10 hours by 2019.
Answers
Try to write down or think of an antonym/opposite word for further practice:
detail describe
electrical appliances toasters, washers, ovens, etc.
a given country a random nation
results causes
housework undertaken chores done
per week each week
Looking from an overall perspective, it is readily apparent that overall
popular common
in particular especially
refrigerators place to keep your food cold
vacuum cleaners pick up dust and dirt on your floor
total complete number
declined steadily decreased at regular intervals
dramatically by a lot
last one hundred years from the last 100 years
witnessed experienced
most significant rise huge increase
beginning at just over starting just above
surging to rising a lot to
continuing to rise keeping going up
until plateauing at leveling off at
started began
rose increase
precisely exactly
tapered slowed
ownership to have/purchase and keep
ultimately reached finally got to
in contrast however
proportions percentages
washing machines where you wash your clothes (if you do that)
climbed rose
fell slightly went down a little
recovered came back up
finish the period at end the time surveyed at
above over
preparing meals making food
after that following this
gradual slowly
slightly above just over
Pronunciation
Practice saying the words below using this tip with Google voice dictation:
ˈdiːteɪl
ɪˈlɛktrɪkəl əˈplaɪənsɪz
ə ˈgɪvn ˈkʌntri
rɪˈzʌlts
ˈhaʊswɜːk ˌʌndəˈteɪkən
pɜː wiːk
ˈlʊkɪŋ frɒm ən ˈəʊvərɔːl pəˈspɛktɪv, ɪt ɪz ˈrɛdɪli əˈpærənt ðæt
ˈpɒpjʊlə
ɪn pəˈtɪkjʊlə
rɪˈfrɪʤəreɪtəz
ˈvækjʊəm ˈkliːnəz
ˈtəʊtl
dɪˈklaɪnd ˈstɛdɪli
drəˈmætɪk(ə)li
lɑːst wʌn ˈhʌndrəd jɪəz
ˈwɪtnɪst
məʊst sɪgˈnɪfɪkənt raɪz
bɪˈgɪnɪŋ æt ʤʌst ˈəʊvə
ˈsɜːʤɪŋ tuː
kənˈtɪnju(ː)ɪŋ tuː raɪz
ənˈtɪl ˈplætəʊɪŋ æt
ˈstɑːtɪd
rəʊz
prɪˈsaɪsli
ˈteɪpəd
ˈəʊnəʃɪp
ˈʌltɪmɪtli riːʧt
ɪn ˈkɒntrɑːst
prəˈpɔːʃənz
ˈwɒʃɪŋ məˈʃiːnz
klaɪmd
fɛl ˈslaɪtli
rɪˈkʌvəd
ˈfɪnɪʃ ðə ˈpɪərɪəd æt
əˈbʌv
prɪˈpeərɪŋ miːlz
ˈɑːftə ðæt
ˈgrædjʊəl
ˈslaɪtli əˈbʌv
Vocabulary Practice
Remember and fill in the blanks:
The line charts d_______l total percentages of e_____________________s in a_______________________y from 1920 to 2019 and the r________s on h_____________k u________________________k. L___________________________________________t all electrical appliances became more p________r, i_______________r r____________s and v______________s. The t_______l time spent doing housework has also d_____________y and d______________y in the l___________________________s.
Refrigerators w__________d the m____________________e, b________________t j_________r 0% in 1920, s__________o more than 50% by 1950, and then c_____________________e steadily u____________________t 100% around 1980. Vacuum cleaners s_________d higher at 30% and then r____e by p___________y 20% every 20 years until 1960 when growth t__________d and o______________________________d 100% by 1980. I__________t, p____________s for w___________________s began at 40%, c__________d to 70% by 1960, then f_____________y, and r___________d to f___________________t just a_______e 70%.
The result for housework was that time spent washing clothes, p___________________s, and cleaning fell steadily from 50 hours a week in 1920 to 20 by 1960. A__________t, the decline was more g__________l, reaching s_____________e 10 hours by 2019.
Listening Practice
Listen to the related topic below and practice with these activities:
Reading Practice
Read more and use these ideas to practice:
https://www.homestratosphere.com/washing-machine-history/
Speaking Practice
Practice with the following related questions from the real IELTS speaking exam:
Buying
- Which item do you buy the most?
- Do you care about the price when buying an item?
- What was the last thing you bought?
- Are good products always expensive?
Writing Practice
Practice with the related line graph below and then check with my sample answer:


Refrigerators witnessed the most significant rise, “beginning” at just over 0% in 1920, “surging” to more than 50% by 1950, and then “continuing” to rise…..
I don’t know the grammar you used in these sentences, why do we use ing form of the verbs ?
Those are used just like relative clauses to add information and modify ‘rise’ – it’s common and I use it is in a lot of my sample essays.
It is known as a gerund and must be after the noun you want to modify, just like a relative clause.
Is that clear, Masi?
Yes it is. Thank you Dave.
You’re welcome, Masi!
The line charts depict the percentage of electrical appliances used in a given country for a period of hundred years and the impact on housework per week over the same period.
Looking from an overall perspective, it is readily apparent that the use of refrigerator and vacuum cleaner rose steadily initial days and now stable at the same position in past few decades. Therefore, the impact falls into the hours of housework per week which are dropped gradually between 1920 to 2019.
To begin with, we saw that the use of refrigerators grew steep up to 90% from 0% in 40 years. Moreover, it reaches 100% in the next 20 years of span. The vacuum cleaner also followed a similar trend but its growth was not that rapid. Although, the usage of vacuum cleaner was 30% in 1920 whereas it became 100% in the year 2000 and then it holds the same percentage. However, the growth of washing machines was not much significant, importantly it saw a fall in growth between 1960 and 1980.
On the other hand, the hours of housework drops steadily from 50% to 20% between 1920 and 1960. After that, it decreased slightly and ended at 10% in 2019.
I like the way you point out the correlation between 2 charts
Thanks Daniel!
thank you I liked the way of your writing
Is it something wrong with the figure of vacuum cleaners, i mean due to the picture it tapered in 1980 and reached 100% in 2000 not 1960 and 1980. I was confused at first
I think it is just a little tricky to see, Kaia.
“The result for housework was that time spent washing clothes, preparing meals, and cleaning fell steadily from 50 hours a week in 1920 to 20 by 1960.”
I read this sentence and I have a question for you.
Why do you use the prepositon ” by 1960 ” ?
Can you explain it to me. Thanks a lot.
Hey can you review my essay.
The charts summarises the amount of time it takes to complete house work in a household and the difference in the electrical appliances ownership in a country between 1920 and 2019.
There are 3 electrical appliance ownerships given in the chart. The general curve is rising but that of a refrigerator is most steep . Between 1920 – 1980 this increases from a 0 to 100 and then becomes stable from 1980 to 2019.
However the curve for a vacuum cleaner has a steady rise compared to the refrigerator. It increases from 30% in 1920 to 100% in 2000. Though similar to the refrigerator curve it also platues but from 2000 to 2019.
Moreover the curve for a washing machine shows the most fluctuations .it increases from 40% in 1920 to 70% in 1960 and then dips in 1980 to 65% but then rises again to around 75% in 2019. Thus accordingly the ownership of a washing machine has seen less significant change as compared to other appliances.
As for the time taken to complete the household work per week has decreased more drastically from 50hrs per week in 1920 to 20 hrs in 1960. After this there is a less remarkable downward slope of just 10hrs between 1960 and 2019
Hi. Can u pls review my report?
The below mentioned two charts depicts the data percentagewise about ownership of electrical appliances and amount of time spent for housework during 1920 to 2019.
Overall, data shows that three electrical appliances named Washing Machine, Vacuum Cleaner & Refrigerator ownership has increased since 1920. Whereas, working hours per week data shows steep declination from 1920 to 2019.
All three electrical appliances demand has shown steep increase, Refrigerator started at 0%, Vacuum at 30% and Washing Machine was at 40% in 1920. It took only 60 years for refrigerator to reach its maximum percentage i.e. 100% in 1980. Meanwhile, for vacuum cleaner, it was in 2000 when it reached to reach 100%. Whereas, Washing machine reached to 70% in 1960 and declined to nearly 62% in 1980 before reaching to its all time high 72% in 2019.
On the contrary, working hours per week significantly declined from 50 hours in 1920 to 20 hours in 1960 and continued declining gradually to 10 hour a week in 2019.
The line graphs show percentage of households with electrical appliances and number of hours of housework per week, per household between 1920 and 2019. overall, using electrical devices and the hours of using them per week had increasing and decreasing trend, respectively.
The percent of using refrigerator have the steepest increase over the period, reaching the all time top value (100%) in 1980 and remaining stable at 100%. In first year, there was not any usage of refrigerator that sharply contrast with vacuum cleaner category. Considering vacuum, the percentages start from 30% and in a rising trend stood at 100% in 2000 and remained until the end of given period.
In the case of washing machine, ownership started from 40% in the first year, in a less volatile trajectory, reach at nearly three forth of citizens having an electrical appliance. The hourly usage of these tools per week in a declining trend started at 50 and stood in 10 hours per week.
The line graphs show how possession of household appliances and the amount of time spent on washing clothes, preparing meals and cleaning altered over a 99 -year period, from 1920 to 2019.
Overall, the first graph shows that the percentages of all the appliances grew while the second one illustrates a downward trend in doing housework.
Refrigerator ownership boomed from 0% in 1920 to 100% in 1980, and then it remained stable until 2019. The figure for vacuum cleaner registered a dramatic growth in 80 years, and reached its peak at 100% in 2000. In terms of washing machine, there was a 30% increase, getting to 70%, before a small decrease ( to around 65%) in 1980, and it climbed slightly by approximately 10%.
As for the second graph, the trend was at 50 hours per week in 1920, and it saw a noticeable decline of 30 hours in 1960. After that the index decreased gradually to almost 10 hours in the last year of the period.
Great, Diyorbek – really nice collocations!