This is an IELTS writing task 1 sample answer essay on the topic of urban and rural population trends and trends in age structure from the real IELTS exam.
Find all the most recent task 1 topics here and my full IELTS Ebooks here.
Dave
IELTS Essay Task 1: Urban and Rural Population Trends
The bar chart illustrates population trends globally by percentage from 1950 to 2040.
Summarise the information by selecting and reporting the main features, and make comparisons where relevant.

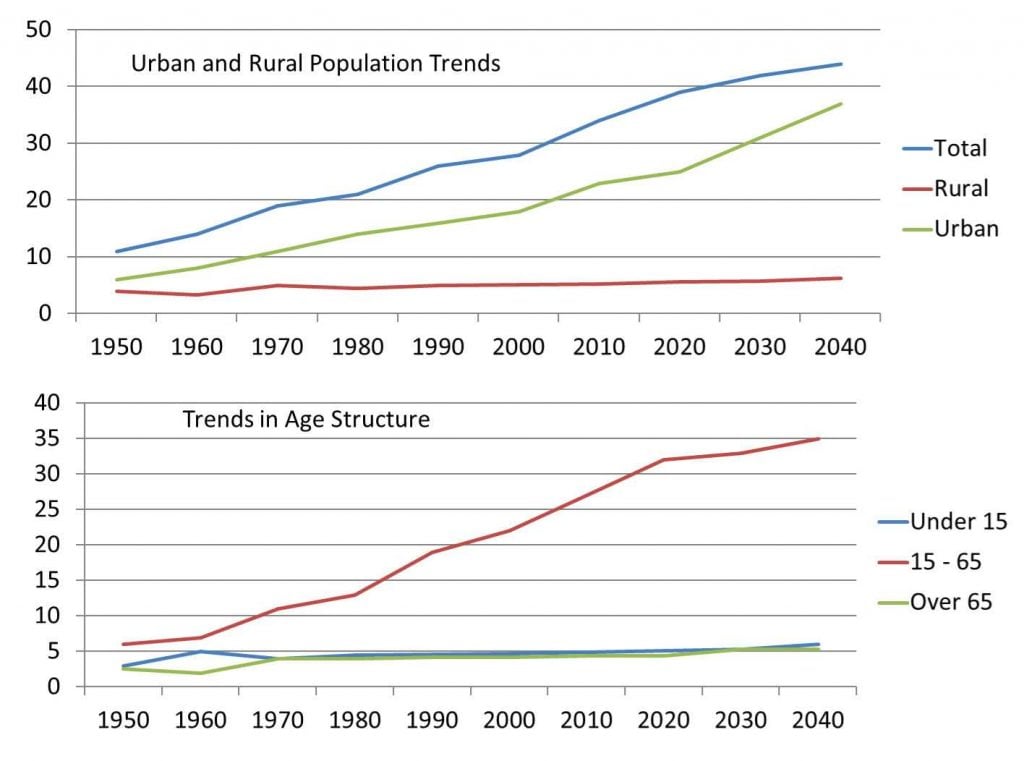
The line charts detail population trends relating to location and age globally from 1950 until 2040. Looking from an overall perspective, it is readily apparent that urban populations have and will continue to constitute the majority of growth. In terms of age demographics, those 15-65 have become by far the largest group and this is predicted to remain the same in the future.
Turning first to urban residency in 1950, this figure began the period at 6%, just 1% above the statistic for the rural population. Over the ensuing years, urban numbers soared, rising by approximately 5% each decade until the present day. This trend is anticipated to continue and urban occupants should represent just under 40% by 2040. In contrast, rural populations were largely steady, increasing under a percentage point every 10 years and anticipated to reach 6% in 2040. The growth in total figures roughly mirror urban percentages but are 5-10% higher throughout.
The age distribution indicates clearly that those 15-65 (beginning at 6% in 1950) will become most common, rising close to 5% each decade with a likely high point of 35% by the end of the period surveyed. Those under 15 and over 65 display a broadly similar pattern at around 5% for the majority of the time described.
Analysis
1. The line charts detail population trends relating to location and age globally from 1950 until 2040. 2. Looking from an overall perspective, it is readily apparent that urban populations have and will continue to constitute the majority of growth. 3. In terms of age demographics, those 15-65 have become by far the largest group and this is predicted to remain the same in the future.
- Paraphrase what the line chart shows.
- Write a clear overview summarising the differences.
- You might need a second sentence for your overview.
1. Turning first to urban residency in 1950, this figure began the period at 6%, just 1% above the statistic for the rural population. 2. Over the ensuing years, urban numbers soared, rising by approximately 5% each decade until the present day. 3. This trend is anticipated to continue and urban occupants should represent just under 40% by 2040. 4. In contrast, rural populations were largely steady, increasing under a percentage point every 10 years and anticipated to reach 6% in 2040. 5. The growth in total figures roughly mirror urban percentages but are 5-10% higher throughout.
- Begin writing about the data for the first category.
- Continue describing it.
- Keep describing the data.
- Compare to the other lines.
- Make sure everything is detailed.
1. The age distribution indicates clearly that those 15-65 (beginning at 6% in 1950) will become most common, rising close to 5% each decade with a likely high point of 35% by the end of the period surveyed. 2. Those under 15 and over 65 display a broadly similar pattern at around 5% for the majority of the time described.
- Write about the final other parts of the line graph – include everything!
- There is a lot of data in this one but try to get to all of it.
Vocabulary
What do the words in bold below mean? Take some notes on a piece of paper to aid your memory:
The line charts detail population trends relating to location and age globally from 1950 until 2040. Looking from an overall perspective, it is readily apparent that urban populations have and will continue to constitute the majority of growth. In terms of age demographics, those 15-65 have become by far the largest group and this is predicted to remain the same in the future.
Turning first to urban residency in 1950, this figure began the period at 6%, just 1% above the statistic for the rural population. Over the ensuing years, urban numbers soared, rising by approximately 5% each decade until the present day. This trend is anticipated to continue and urban occupants should represent just under 40% by 2040. In contrast, rural populations were largely steady, increasing under a percentage point every 10 years and anticipated to reach 6% in 2040. The growth in total figures roughly mirror urban percentages but are 5-10% higher throughout.
The age distribution indicates clearly that those 15-65 (beginning at 6% in 1950) will become most common, rising close to 5% each decade with a likely high point of 35% by the end of the period surveyed. Those under 15 and over 65 display a broadly similar pattern at around 5% for the majority of the time described.
Answers
Try to write down or think of an antonym/opposite word for further practice:
detail illustrate
population trends patterns for how many people
globally around the world
Looking from an overall perspective, it is readily apparent that urban overall
constitute make up
majority most of
growth increase
In terms of when it comes to
demographics groups of people
by far a lot more than
predicted expected to
remain stay the same
in the future later
turning first to considering firstly
residency living there
figure number
period time given
above over
statistic figure
over the ensuing years during the next span of time
soared increased a lot
rising increasing
approximately around
each decade every 10 years
until the present day up until now
anticipated predicted
continue keep going
occupants people living there
represent stand for
largely steady mostly unchanged
under a percentage point every 10 years less than 1% each decade
anticipated expected
reach get to
roughly mirror almost the same as
higher throughout above it the whole time
distribution how it is spread out
indicates clearly shows definitely
common ubiquitous
with a likely high point of probably reaching the top at
by the end of the period surveyed for the whole time detailed
display a broadly similar pattern has almost the same trend
majority most of
described shown
Pronunciation
Practice saying the words below using this tip with Google voice dictation:
ˈdiːteɪl
ˌpɒpjʊˈleɪʃən trɛndz
ˈgləʊbəli
ˈlʊkɪŋ frɒm ən ˈəʊvərɔːl pəˈspɛktɪv, ɪt ɪz ˈrɛdɪli əˈpærənt ðæt ˈɜːbən
ˈkɒnstɪtjuːt
məˈʤɒrɪti
grəʊθ
ɪn tɜːmz ɒv
ˌdɛməˈgræfɪks
baɪ fɑː
prɪˈdɪktɪd
rɪˈmeɪn
ɪn ðə ˈfjuːʧə
ˈtɜːnɪŋ fɜːst tuː
ˈrɛzɪdənsi
ˈfɪgə
ˈpɪərɪəd
əˈbʌv
stəˈtɪstɪk
ˈəʊvə ði ɪnˈsjuːɪŋ jɪəz
sɔːd
ˈraɪzɪŋ
əˈprɒksɪmɪtli
iːʧ ˈdɛkeɪd
ənˈtɪl ðə ˈprɛznt deɪ
ænˈtɪsɪpeɪtɪd
kənˈtɪnju(ː)
ˈɒkjʊpənts
ˌrɛprɪˈzɛnt
ˈlɑːʤli ˈstɛdi
ˈʌndər ə pəˈsɛntɪʤ pɔɪnt ˈɛvri tenjɪəz
ænˈtɪsɪpeɪtɪd
riːʧ
ˈrʌfli ˈmɪrə
ˈhaɪə θru(ː)ˈaʊt
ˌdɪstrɪˈbjuːʃən
ˈɪndɪkeɪts ˈklɪəli
ˈkɒmən
wɪð ə ˈlaɪkli haɪ pɔɪnt ɒv
baɪ ði ɛnd ɒv ðə ˈpɪərɪəd sɜːˈveɪd
dɪsˈpleɪ ə ˈbrɔːdli ˈsɪmɪlə ˈpætən
məˈʤɒrɪti
dɪsˈkraɪbd
Vocabulary Practice
Remember and fill in the blanks. Note it on a piece of paper so you can remember better:
The line charts d_______l p_____________________s relating to location and age g___________y from 1950 until 2040. L_________________________________________________t u_______n populations have and will continue to c____________e the m_________y of g_______h. I_________________f age d_____________s, those 15-65 have become b_____r the largest group and this is p__________d to r________n the same i_____________e.
T________________o urban r__________y in 1950, this f________e began the p_______d at 6%, just 1% a_______e the s_________c for the rural population. O____________________________s, urban numbers s________d, r_______g by a______________________y 5% e__________________________________y. This trend is a___________d to c__________e and urban o___________s should r__________t just under 40% by 2040. In contrast, rural populations were l________________y, increasing u___________________________________________s and a____________d to r______h 6% in 2040. The growth in total figures r_____________________r urban percentages but are 5-10% h____________________t.
The age d______________n i______________________y that those 15-65 (beginning at 6% in 1950) will become most c________n, rising close to 5% each decade w________________________________f 35% b______________________________________d. Those under 15 and over 65 d___________________________________n at around 5% for the m___________y of the time d__________d.
Listening Practice
Listen to the related topic below and practice with these activities:
Reading Practice
Read more and use these ideas to practice:
Speaking Practice
Practice with the following related questions from the real IELTS speaking exam:
Countryside
- Why is the country quieter than the city?
- Why do many people prefer to live in the countryside?
- Where are the quietest places in cities?
- What will the countryside look like in your country in the future?
- Are there any drawbacks to investing in public transport in the countryside?
Writing Practice
Practice with the related line chart below and then check with my sample answer:


Hello sir, in last paragraph (beginning at 6% in 1950), can we use ‘began’ instead of ‘beginning’ as it is past tense(1950)?
The line chart compares the difference of populition in region and age structure for 90 years.
In area structure, we can see a rise in total population which is primarily contributed by urban people. As for age structure, the population between 15 and 65 years old increases dramatically.
Compare with urban and rural population trends, the urban population goes up from about 6 percent in 1950 to nearly 40 percent in 2040. And the population in rural stay in about 4 to 7 percent over 90 years. The difference between urban and rural population keeps raising, which is about 1 percent in 1950 to 30 percent in 2040.
In the age structure, the population of kids under 15 and old people over 65 have only little change, which stays about 3 percent to 5 percent over 90 years. While the percentage of people between 15 and 65 years old increases alot, which raises from 6 percent in 1950 to 35 percent in 2040. The distance of percentage between people between 15 and 65 years old and others become huge, which is 3 percent in 1950 to 30 percent in 2040.
Nice Gakki!
Area structure isn’t really a term we use in English and some informal vocabulary like ‘keeps raising’ – keep working hard!
The graphs detail about the population trends in urban and rural areas along with the age distribution throughout out the years 1950 to 2040. Looking from an overall perspective, it is readily apparent that urban population has gradually increased along with the significant spike of the 15 to 65 age group. Giving the idea of greater urbanization due to the surge in people of ages 15 to 65.
Breaking it down, the age group 15 to 65 hiked from 6 in 1950 to 35 in 2040 along with fluctuations throughout the years. Following this trend, the urban population upsurged from 6 to 38 with slight dips from 1950 to 2040.
In contrast, the age distribution, over 65 has increased but at a considerably low rate from 3 to 5 with a drop to 2 at the year 1960. Hence leading to an unnoticeable growth in the rural population from approximately 4 to 5.
Lastly, children under the age of 15 had the same trend as adults over 65 rather than the slight increase in the 60’s. The total population has also flourished to 45 in 2040 from 11 in the 50’s as it’s a combination of both the rural and urban population.
is these sentences right?
The line charts compare and contrast data on the population levels in terms of location and age globally from 1950 until 2040
The age distribution indicates clearly that the second youngest group have and will experience almost identical trends with the urban group apart from a rise of only approximately 2% in the first and the two last decades which results in a slightly lower point of 35% by the end of the period surveyed
The first one is correct but the second one is a mess…
The same question was asked in March 19, 2022, Afternoon slot. Thankyou.
The line graphs depict the percentage of world population growth from 1950 to 2040. The surveyed trends are divided into 2 groups: Urban and Rural population and Trends in Age structure.
Overall, the total amount of population together with people from urban areas are forecasted to increase significantly by the year 2040 , greatly outstripping Rural population anticipated to remain relatively steady. The number of individuals aged from 15 to 65 will escalate substantially, compared to the those aged under 15 and those who are over 65.
In terms of Rural and urban population trends, from the 1950 to 2040, the total number of population will grow from around 10% to well over 40%, followed by Urban trend gradually increasing from less than 10% in 1950 year to near 40% by the year 2040. The population of Rural people will slightly increase adding approximately 2% by the year 2040.
According to the trends in Age structure, the amount of people aged from 15 to 65 is anticipated to remain the leading, increasing from more than 5% in 1950 to 35% by the year 2040. Population of children under 15 and old people over 65 will slightly increase from around 2,5% to more than 5% by the year 2040, however, within the period from 1950 to 1970, the number of children greatly outnumbered those over 65 by more than a half of their population.