This is an IELTS writing task 1 sample answer essay on the topic of a bar chart showing airline ticket prices from the real IELTS exam.
Find all the most recent task 1 topics here and my full IELTS Ebooks here and my online courses here.
Dave
IELTS Essay Task 1: Visitors to the UK Spending Table
The table below shows the number of visitors in the UK and their average spending from 2003 to 2008.
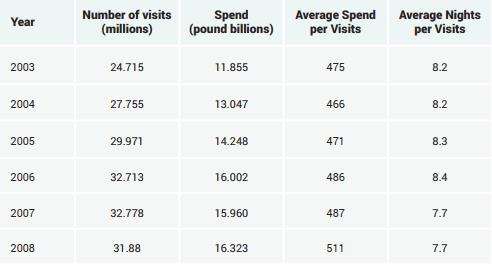
The table displays information regarding visitors, spending and the length of their trip to the UK from 2003 to 2008. Looking from an overall perspective, it is readily apparent that overall visits, total spending, and average spending rose considerably with only average nights per visit falling towards the end of the period. The largest growth proportionally was for total spending.
Looking first of all at quantity of visits, there were 24,715,000 million travellers to the UK in 2003 and this figure climbed steadily by around 2 to 3 million each year until 2006 when it plateaued at about 32 million before receding slightly to 31.8 million to finish the time surveyed. Similarly, average spending in billions of pounds rose sharply from 11.855 to a 16.002 in 2006, then leveled off and, in contrast, rebounded marginally to finish the period at 16.323.
In terms of average spending, this figure began at 475 pounds in 2003, declined moderately to 266 the next year and then rose consistently to conclude with a final surge to 511 in 2008. The only data to decline was average nights per visit which began at 8.2 in 2003, remained level for a year and then rose by .1 each year until 2006, before a sudden drop to 7.7 nights in 2007 and 2008.
Analysis
1. The table displays information regarding visitors, spending and the length of their trip to the UK from 2003 to 2008. 2. Looking from an overall perspective, it is readily apparent that overall visits, total spending, and average spending rose considerably with only average nights per visit falling towards the end of the period. 3. The largest growth proportionally was for total spending.
- Paraphrase what the table shows.
- Write a clear overview summarising the differences.
- You might need another sentence for your overview.
1. Looking first of all at quantity of visits, there were 24,715,000 million travellers to the UK in 2003 and this figure climbed steadily by around 2 to 3 million each year until 2006 when it plateaued at about 32 million before receding slightly to 31.8 million to finish the time surveyed. 2. Similarly, average spending in billions of pounds rose sharply from 11.855 to a 16.002 in 2006, then leveled off and, in contrast, rebounded marginally to finish the period at 16.323.
- Begin writing about the data for the first categories.
- Make sure you compare as much as possible.
1. In terms of average spending, this figure began at 475 pounds in 2003, declined moderately to 266 the next year and then rose consistently to conclude with a final surge to 511 in 2008. 2. The only data to decline was average nights per visit which began at 8.2 in 2003, remained level for a year and then rose by .1 each year until 2006, before a sudden drop to 7.7 nights in 2007 and 2008.
- Write about the final other parts of the graph – include everything!
- Compare the categories.
Vocabulary
What do the words in bold below mean? Take some notes on a piece of paper to aid your memory:
The table displays information regarding visitors, spending and the length of their trip to the UK from 2003 to 2008. Looking from an overall perspective, it is readily apparent that overall visits, total spending, and average spending rose considerably with only average nights per visit falling towards the end of the period. The largest growth proportionally was for total spending.
Looking first of all at quantity of visits, there were 24,715,000 million travellers to the UK in 2003 and this figure climbed steadily by around 2 to 3 million each year until 2006 when it plateaued at about 32 million before receding slightly to 31.8 million to finish the time surveyed. Similarly, average spending in billions of pounds rose sharply from 11.855 to a 16.002 in 2006, then leveled off and, in contrast, rebounded marginally to finish the period at 16.323.
In terms of average spending, this figure began at 475 pounds in 2003, declined moderately to 266 the next year and then rose consistently to conclude with a final surge to 511 in 2008. The only data to decline was average nights per visit which began at 8.2 in 2003, remained level for a year and then rose by .1 each year until 2006, before a sudden drop to 7.7 nights in 2007 and 2008.
Answers
Try to write down or think of an antonym/opposite word for further practice:
displays information gives data
regarding concerning
visitors people going there
spending money spent
length how long
trip visit
the UK the United Kingdom
Looking from an overall perspective, it is readily apparent that overall overall
average per each person
rose considerably grew a lot
average nights per visit falling days stayed on the trip declining
towards the end of the period at the conclusion of the time detailed
largest growth proportionally rose the most in comparison
looking first of all at considering firstly
quantity number
travellers people going there
climbed steadily increased consistently
until up until the point
plateaued levelled off
receding slightly declining a little
finish end
time surveyed period detailed here
similarly almost the same
rose sharply increased a lot
leveled off plateaued
in contrast however
rebounded marginally recovered a little
finish the period at ended the time at
in terms of concerning
declined moderately went down a little
rose consistently went up steadily
conclude end
final surge last big increase
data figures
remained level stayed the same
sudden drop unexpected fall
Pronunciation
Practice saying the words below using this tip with Google voice dictation:
Vocabulary Practice
The table d_______________________n r_____________g v__________s, s_________g and the l______h of their t____p to t_______K from 2003 to 2008. L__________________________________________________l visits, total spending, and a__________e spending r____________________y with only a_______________________t f_________g t______________________d. The l____________________________y was for total spending.
L________________________t q__________y of visits, there were 24,715,000 million t____________s to the UK in 2003 and this figure c___________________y by around 2 to 3 million each year u______l 2006 when it p___________d at about 32 million before r__________________y to 31.8 million to f_________h the t_________________d. S____________y, average spending in billions of pounds r_______________y from 11.855 to a 16.002 in 2006, then l______________f and, i______________t, r______________________y to f_____________________t 16.323.
I_____________f average spending, this figure began at 475 pounds in 2003, d_____________________y to 266 the next year and then r______________y to c____________e with a f___________e to 511 in 2008. The only d____a to decline was average nights per visit which began at 8.2 in 2003, r______________l for a year and then rose by .1 each year until 2006, before a s_____________p to 7.7 nights in 2007 and 2008.
Listening Practice
Reading Practice
https://www.planetware.com/england/best-places-to-visit-in-the-uk-eng-1-2.htm
Speaking Practice
Practice with the following related questions from the real IELTS speaking exam:
Flying
- Are there many airlines in your country?
- Have you ever flown anywhere?
- Where would you like to fly?
- Are you scared of flying?
Writing Practice
Practice with the related chart below and then check with my sample answer:


Thanks to you for presentation but it is very hard topics
Good to practice with then!