
Be sure to avoid the mistakes that most students make on writing by signing up for my exclusive IELTS Ebooks here on Patreon.
A lot of my students freak out when they see a table. All they can see are the numbers, which means they have to look hard to find the main trends. Even if they can identify (find) one main pattern, they often miss something important.
In this post I show you how to make notes on the table so you can recognise (see) and remember ALL the main trends and key similarities or differences. You can check out a sample answer (and much more) for this question here.
Here is a recent question from IELTS Cambridge 14.
As well as our Task 1 sample answers, check out our Task 2 sample essays here: IELTS Writing Task 2 Sample Answers.
You can also subscribe to our YouTube Channel for some IELTS Speaking Sample Answers: HowtodoIELTS YouTube.
Dave
What kind of Table?
The first thing to remember is that there are two main kinds of chart – some focus on changes over a period of time (also known as ‘dynamic’), while some focus on one period of time (known as ‘static’).
You need to be able to recognise the two different types as they require different vocabulary and grammar. In a previous post I showed you how to analyse the first kind of table (over time), and in this post we will look at the second type (not over time).
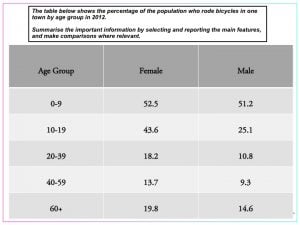
Look at the table below, based on a real question from the IELTS Writing exam from Feb 2018. It focuses on the percentages of males and females that cycled in a particular town in 2012, organised into five different age groups. You can check out a sample answer (and much more) for this question here.
Firstly, you should notice the following things:
-
This chart is not over time – just one year (2012).
-
The data is organised in two main ways – gender (males and females) and age (five groups).
-
The figures are proportions of the total number (the % of males or females), not the number of people (males/females).
Main Trends and Key Similarities / Differences (Gender)
Next pick up your pencil and make notes on all of the main trends and key differences and/or similarities. Remember that you need to look ACROSS (gender) and DOWN (age) the table.
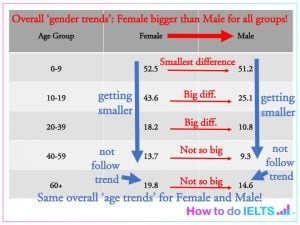
Let’s look at gender (across) first – you should be looking for an overall pattern if possible. You can see that the proportion of females that cycled was higher than males. And in fact this pattern is not just overall, but for EVERY age group, without exception.
To help me remember this I drew a big arrow at the top from Female to Male and wrote above it “Overall ‘gender trends’: Female bigger than Male for all groups!”
You should also look at the size of the differences. For example, you can see that the smallest gender gap was in the youngest group, whereas the next two groups had the biggest differences, and finally the gap for the two oldest groups was not so big.
I made a note of all these differences, drawing small arrows between each set of figures, and noting the size of the differences.

Main Trends and Key Similarities / Differences (Age)
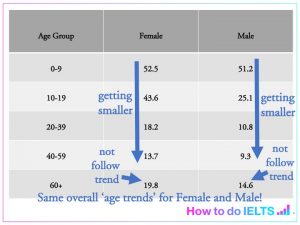
Now, let’s turn our attention to analysing the pattern DOWN the table. You can see that for both Females and Males, as people got older there was a smaller proportion of people cycling, with the exception of the oldest group.
Again to help me remember this, I drew two big arrows going down the table for Female and Male, and I wrote below it “getting smaller”.
I also drew two small arrows pointing to the figures for the oldest groups and wrote ‘not follow trend’.
As the trend is the same for both Females and Males I wrote at the bottom “Same overall ‘age trends’ for Female and Male!”
So in the exam, your question paper should end up looking something like the one below. This might look like a mess but believe me, this will really help you to find all the important information needed to get a high score for your Task Achievement in IELTS Writing Task 1.
Try it out and let me know how it goes.


how i start the exam please, help me?
Hi Netsanet, check out this: https://howtodoielts.com/learn-ielts-faster/ If you have any questions, please let us know.
What exactly do you need help with?
Can you comment on my answer, thanks.
“We can easily that more female travel by bike than male. Also, the differences between male and female in the same age group decrease steadily as they grow up, except for the youngest ages (0-9) where there is almost no distinction between the two genders.”
Here is how I would rewrite it: ‘We can easily see that more females travel by bus than males. Also the differences between males and females in the same age group decreased steadily as they got older, except for the youngest age group where this is almost no distinction between genders’ Great writing!
The table demonstrates the proportions and age groups of males and females, who participated in cycling activity in one town in the year 2012.
Overall, female riders were more than males in all age groups, but both males and females showed a declining trend for riding bicycles as they got older, before it started to rise again for the oldest age group. Although the smallest difference noticed between males and females in the youngest age, big differences can be seen in the following two groups, and nearly the same difference between them for the last two age groups.
The given table illustrates the percentage of residents of five distinct age group in a town who cycled in the year 2012.
Overall, it is clear that riding bicycles was most popular among children under 10 years old, while the lowest proportion was from those who was aged from 40 to 59. In addition, regardless of their age, females cycled more than males did.
In 2012, 52,5% of cyclists in this town was boys aged under 10, just 1,3% higher than the percentage of the girls at the same age. The second highest figure was from the age between 10 and 19, at which age the proportion of female cyclists approximately doubled that of male (43,6% and 25,1% respectively).
When reaching the age from 20 to 39, only 18,2% of people riding bikes was women, while just over 10% of them was men. These figures were even lower regarding the 40-59 age group, with 13,7% and under 10% of cyclists being female and male respectively. However, people aged over 60 years old appeared to cycle more, with women at this age accounting for nearly 20% and men making up around 15%.
Please give me some comments! Thank you so much!
Nice work, Jenny!
Great overview and very accurate description of the data, careful with subject/verb agreement and don’t use opinion words like ‘appeared’.
Thank you for your comments, Dave!
I just have another question, what does the total percentage present? For example, should I understand 52,5% of the cyclists in the town or 52,5% the total population of the town?
Hope you will clear my doubt!
It means the total population – good question, Jenny!
Can you comment on my answer, thanks.
The given table illustrates the percentage of residents of five distinct age group in a town who cycled in the year 2012.
Overall, as both female and male got older, the figure for them represented a degradation, except for the oldest group. Moreover, regardless of their age, females cycled more than males did. In addition, it is evident that riding bicycles was most famous among children under 10 years old, while the lowest rate was from those who was aged from 40 to 59.
In 2012, in range of 0 to 9 years old, 52,5% percent of cyclists were female, just approximately 1% higher than the porpotion of male at the same age. In addition, people, who cycled between the age of 10 and 19, illustrated the biggest difference of 18%, with the 43,6% of women and 25,1% of man.
Regarding 20-39 age group, the rate for women reached 18,2%, which is nearly 2 times higher compared to the percentage of men. This figures even lower in terms of cycling people under 60, just under 10% for male and rougly 5% higher for female. However, in the last age group, both figure for women and men suddenly increased to 19,8% and 14,6% respectively.
Nice writing, An!
Represented a degradation is a bit of an odd phrase – you can just say the figures decline as they get older – is that true throughout though?
Nice accuracy with the data!
only the paragraph 1:
the table details information about cycling in different age brackets across genders.Looking from an overall perspective, it’s readily apparent that people’s inclination
for cycling declines through aging, with the exception of individuals over 60.what is also worthy of notice is that the proportion of women riding bikes overtakes that of men in each of the age groups.