This is an IELTS writing task 1 sample answer essay on the topic of social media presences for small, medium, and large businesses in the UK from the real IELTS exam.
Find all the most recent task 1 topics here.
Dave
IELTS Essay Task 1: Social Media Presence for Businesses
The bar chart illustrates the percentage of businesses in the UK who had a social media presence from 2012 to 2016.
Summarise the information by selecting and reporting the main features, and make comparisons where relevant.
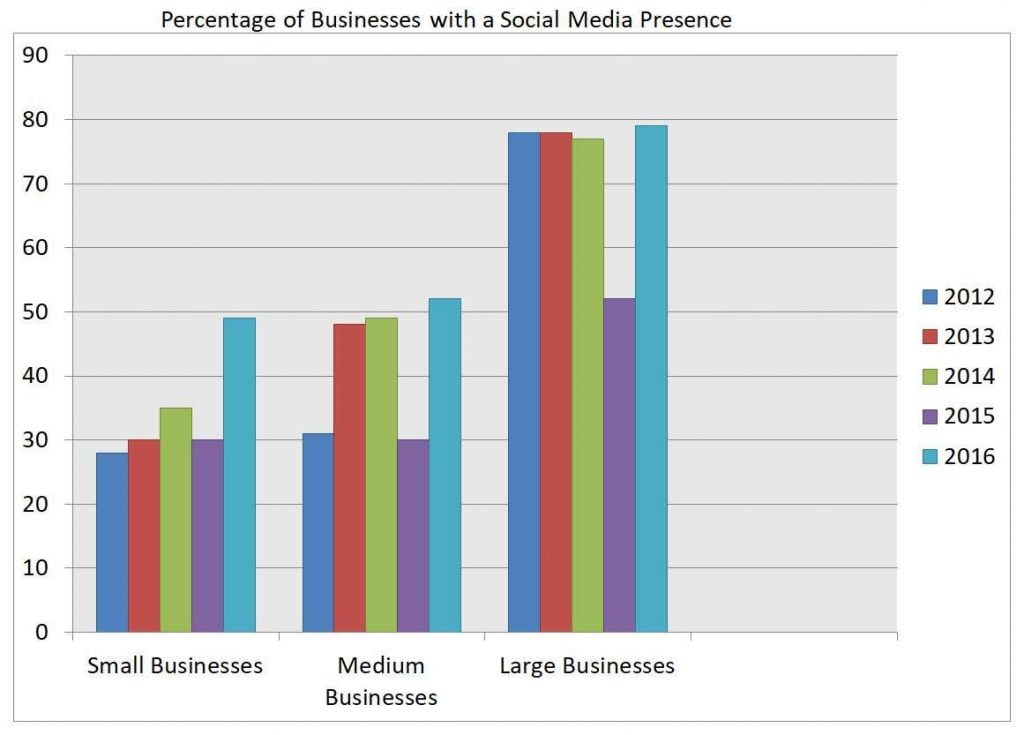
The bar chart displays data concerning the social media presence of small, medium and large businesses in the UK between 2012 and 2016. Looking from an overall perspective, it is readily apparent that figures for all types of businesses grew despite a widespread and significant pullback in 2015. Large businesses increased the least yet had by far the greatest presence each individual year.
In terms of small businesses, less than 30% (the lowest data point on the chart) had a social media presence in 2012. This number then rose to 35% by 2014, before a pullback to 30%, and a final surge to fewer than 50% with a presence to end the period. The trend for medium-sized businesses was similar, beginning at 31%, rising significantly to slightly under 50% in 2013 and 2014, falling to 30% in 2015, before finally growing to 52% by 2016.
The proportions for large businesses were more than double small and medium enterprises to begin the period (78%). This figure largely plateaued until 2015 when it fell to its nadir of 51%, preceding a final recovery to 79% in 2016.
Analysis
1. The bar chart displays data concerning the social media presence of small, medium and large businesses in the UK between 2012 and 2016. 2. Looking from an overall perspective, it is readily apparent that figures for all types of businesses grew despite a widespread and significant pullback in 2015. 3. Large businesses increased the least yet had by far the greatest presence each individual year.
- Paraphrase what the bar chart shows.
- Write a clear overview summarising the differences.
- You might need a second sentence for your overview.
1. In terms of small businesses, less than 30% (the lowest data point on the chart) had a social media presence in 2012. 2. This number then rose to 35% by 2014, before a pullback to 30%, and a final surge to fewer than 50% with a presence to end the period. 3. The trend for medium-sized businesses was similar, beginning at 31%, rising significantly to slightly under 50% in 2013 and 2014, falling to 30% in 2015, before finally growing to 52% by 2016.
- Begin writing about the data for the first category.
- Describe the next area and compare it to the area before.
- Continue describing the data.
1. The proportions for large businesses were more than double small and medium enterprises to begin the period (78%). 2. This figure largely plateaued until 2015 when it fell to its nadir of 51%, preceding a final recovery to 79% in 2016.
- Write about the final other parts of the bar chart – include everything!
- There is a lot of data in this one but try to get to all of it.
Vocabulary
What do the words in bold below mean? Take some notes on a piece of paper to aid your memory:
The bar chart displays data concerning the social media presence of small, medium and large businesses in the UK between 2012 and 2016. Looking from an overall perspective, it is readily apparent that figures for all types of businesses grew despite a widespread and significant pullback in 2015. Large businesses increased the least yet had by far the greatest presence each individual year.
In terms of small businesses, less than 30% (the lowest data point on the chart) had a social media presence in 2012. This number then rose to 35% by 2014, before a pullback to 30%, and a final surge to fewer than 50% with a presence to end the period. The trend for medium-sized businesses was similar, beginning at 31%, rising significantly to slightly under 50% in 2013 and 2014, falling to 30% in 2015, before finally growing to 52% by 2016.
The proportions for large businesses were more than double small and medium enterprises to begin the period (78%). This figure largely plateaued until 2015 when it fell to its nadir of 51%, preceding a final recovery to 79% in 2016.
Answers
Try to write down or think of an antonym/opposite word for further practice:
displays data shows statistics
concerning having to do with
social media presence how active you are on Instagram, Facebook, TikTok, etc.
small, medium and large businesses local and international companies
the UK England, the United Kingdom
Looking from an overall perspective, it is readily apparent that figures overall
all types of every kind of
grew despite increased regardless of
widespread common throughout
significant pullback big reduction
least yet lowest however still
by far a lot more
greatest biggest
each individual year every single year in question
in terms of when it comes to
less than lower compared to
lowest the least
rose increased
final surge last increase
fewer than less than
to end the period at the end of the time surveyed
trend pattern
medium-sized not too big or small
similar almost the same
beginning at starting at
rising significantly to increasing a lot to
slightly under a little less than
falling to decreasing to
before finally prior to a last
proportions percentages
more than double 200%+
enterprises companies
to begin the period at the start
largely plateaued until mostly stay the same up to
fell decreased
nadir lowest point
preceding before
recovery coming back to its previous number
Pronunciation
Practice saying the words below using this tip with Google voice dictation:
dɪsˈpleɪz ˈdeɪtə
kənˈsɜːnɪŋ
ˈsəʊʃəl ˈmiːdiə ˈprɛzns
smɔːl, ˈmiːdiəm ænd lɑːʤ ˈbɪznɪsɪz
ðə juː-keɪ
ˈlʊkɪŋ frɒm ən ˈəʊvərɔːl pəˈspɛktɪv, ɪt ɪz ˈrɛdɪli əˈpærənt ðæt ˈfɪgəz
ɔːl taɪps ɒv
gruː dɪsˈpaɪt
ˈwaɪdsprɛd
sɪgˈnɪfɪkənt ˈpʊlbæk
liːst jɛt
baɪ fɑː
ˈgreɪtɪst
iːʧ ˌɪndɪˈvɪdjʊəl jɪə
ɪn tɜːmz ɒv
lɛs ðæn
ˈləʊɪst
rəʊz
ˈfaɪnl sɜːʤ
ˈfjuːə ðæn
tuː ɛnd ðə ˈpɪərɪəd
trɛnd
ˈmiːdiəm-saɪzd
ˈsɪmɪlə
bɪˈgɪnɪŋ æt
ˈraɪzɪŋ sɪgˈnɪfɪkəntli tuː
ˈslaɪtli ˈʌndə
ˈfɔːlɪŋ tuː
bɪˈfɔː ˈfaɪnəli
prəˈpɔːʃənz
mɔː ðæn ˈdʌbl
ˈɛntəpraɪzɪz
tuː bɪˈgɪn ðə ˈpɪərɪəd
ˈlɑːʤli ˈplætəʊd ənˈtɪl
fɛl
ˈneɪdɪə
pri(ː)ˈsiːdɪŋ
rɪˈkʌvəri
Vocabulary Practice
Remember and fill in the blanks. Note it on a piece of paper so you can remember better:
The bar chart d_____________________________g the s______________________e of s______________________________s in t________K between 2012 and 2016. L________________________________________________________________s for a______________f businesses g_____________e a w___________d and s____________k in 2015. Large businesses increased the l________t had b______r the g__________t presence e__________________r.
I______________f small businesses, l____________n 30% (the l_________t data point on the chart) had a social media presence in 2012. This number then r_____e to 35% by 2014, before a pullback to 30%, and a f___________e to f____________n 50% with a presence t_________________d. The t_______d for m_______________d businesses was s__________r, b_____________t 31%, r________________________o s________________r 50% in 2013 and 2014, f_____________o 30% in 2015, b____________y growing to 52% by 2016.
The p______________s for large businesses were m_______________e small and medium e_____________s t__________________d (78%). This figure l_______________________l 2015 when it f_____l to its n_________r of at 51%, p___________g a final r__________y to 79% in 2016.
Listening Practice
Listen to the related topic below and practice with these activities:
Reading Practice
Read more and use these ideas to practice:
Speaking Practice
Practice with the following related questions from the real IELTS speaking exam:
Concentration (Ebook available on my Patreon)
- Do you find it hard to concentrate?
- What do you do to concentrate better?
- Did you concentrate on your studies a lot when you were younger?
Writing Practice
Practice with the related table below and then check with my sample answer:


IELTS Essay Task 1: Social Media Presence for Businesses
I think this should be corrected as 2012
In terms of small businesses, less than 30% (the lowest data point on the chart) had a social media presence in 2014
Thanks for noticing that – updated!
//:0
The given chart illustrate how the prices of navigation system and smart phones changed in somecountry during July 2004 to Dec 2006.
In 2004 july to december the prices of navigation system was at the peak that is almost 4000 similar the prices of smart phones was around 3100 the highest ever. In the first half of 2005 there is a huge drop in the prices of navigation system it dropped down and reached at 3200.while the price of smart phones drop slightly and reached at 2700.
In the period of july-dec 2006 the prices of both gadgets reached at almost same prices . There is a minor increase in the prices of smart phones and and decrease in the prices of navigation systems that is 3100 and 2900.
During first half of 2006 the navigation system prices again rose up at 3500 while the prices of smart phones dropped and come at 2200. In the period of july-december 2006 the prices for mobile phones remain same although the prices of navigation system dropped and this is the first time both gadgets had the same prices that is 2200.
please review
The figure compares the rate of businesses with a social media presence among small, medium, and large businesses from 2012 to 2016.
Large businesses had the highest rate of social media presence from 2012 to 2016, which kept a steady tendency for 5 years except in 2015. While small businesses were always the lowest percentage, it saw a sharp increase in 2016.
From 2012 to 2016, the highest percentage of businesses with a social media presence was large businesses. The percentage of large business was around 80 percent in other 4 years, except for a nearly 25 percent drop in 2015. Small businesses stayed around 30 percent from 2012 to 2015, and rised to 49 percent in 2016.
The percentage of medium businesses was in the middle in these 3 kinds of businesses. The percentage of medium businesses is around 30 percent in 2012 and 2015, which was similar to that of small businesses in the same years. Nearly 50 percent of medium businesses had a social media presence in 2013 and 2014, and it rose to more than 50 percent in 2016, which was a little higher than that of small businesses.
Good Gakki – you don’t need to list the years so specifically in the general overview though.
Nice description of the data after that!
Thank you for reminding me. I’ll pay attention to it next time!
In terms of small businesses, less than 30% (the lowest point on the chart) had a social media presence in 2021. This number then rose to 35% by 2014, before a pullback to the 2013 level(30%), and a final surge to fewer than 50% with a presence to end the period.
The trend for medium-sized businesses was almost identical. This can clearly be seen when the proportions of the two smaller categories in 2015 were exactly the same and the difference in the start and the end of the period years was only approximately 2%
However, the gap widened dramatically as almost half of the medium businesses had a social media presence in the other two years.
Large businesses stayed around 78% for the majority of the period described apart from a dip to 51% in 2015.
is it too repetitive or too much unnecessary information, sound weird?
It’s good to include a lot of data! Keep doing that!
thanks a lot. you are so kind.
but if I compare the two categories like that will it sound confusing for the reader?
The trend for medium-sized businesses was almost identical. This can clearly be seen when the proportions of the two smaller categories in 2015 were exactly the same and the difference in the start and the end of the period years was only approximately 2%
However, the gap widened dramatically as almost half of the medium businesses had a social media presence in the other two years.
You’re welcome!
Comparing is the opposite of confusing – you should do that between every sentence to link your writing and so it doesn’t sound mechanical.