This is an IELTS writing task 1 sample answer essay featuring two graphs, a pie chart and a bar chart, related to students in Singaport for 200 to 2010.
For more sample answers like the one below, follow my Patreon here.
Dave
IELTS Essay: Two Graphs (Pie and Bar Charts)
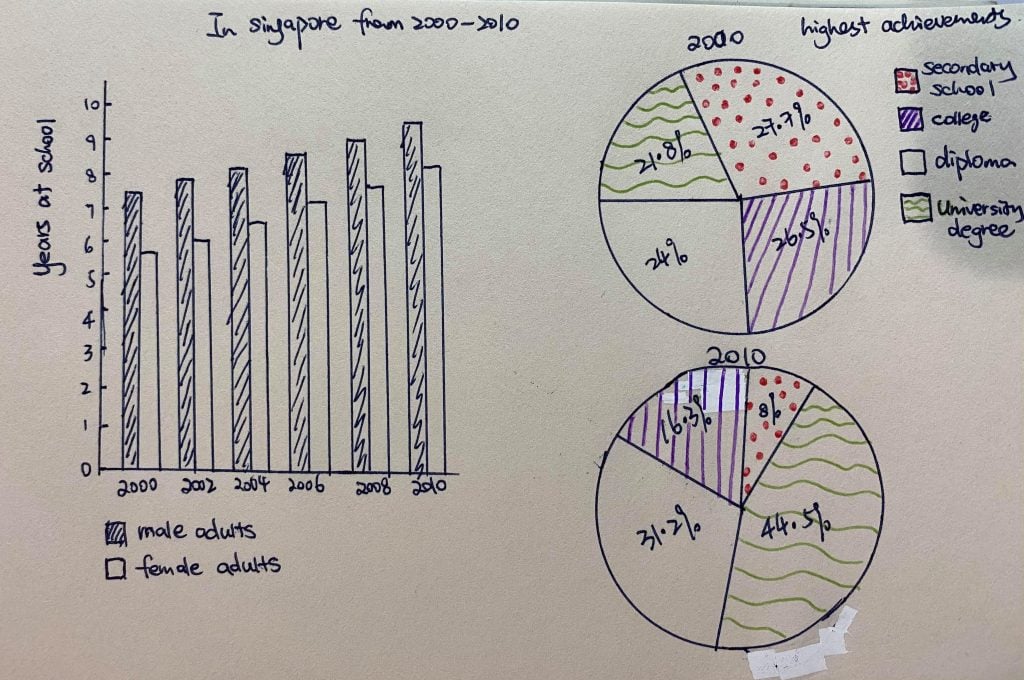
The bar chart records how long students spent in school by gender in two year intervals from 2000 to 2010, while the pie charts break down where they were studying. In general, both males and females saw steady rises in years spent at school, though male figures were always higher. In 2000, there were largely equal proportions for secondary, college, diplomas and university degrees but by 2010 university had more students, largely at the expense of secondary school.
In Singapore in 2000, males spent around 7.5 years in school and females were at 5.5. This difference of 2 years remained nearly identical over the period as the numbers for males rose steadily to over 9 to finish the period and women had narrowed the gap slightly to just under 8 years.
Turning to the types of schooling, in 2000 most students were in secondary school (27.7%) which was 1.2% higher than college, 3.7% more than those studying for diplomas and well above university degrees at 21.8%. By 2010, university degrees had surged to 44.5% and secondary declined to 8%. College students also made up a smaller proportion at 16.3%, while diploma students rose by about a third to 31.2%.
Analysis
1. The bar chart records how long students spent in school by gender in two year intervals from 2000 to 2010, while the pie charts break down where they were studying. 2. In general, both males and females saw steady rises in years spent at school, though male figures were always higher. 3. In 2000, there were largely equal proportions for secondary, college, diplomas and university degrees but by 2010 university had more students, largely at the expense of secondary school.
- Paraphrase what the graph shows.
- Start your general overview.
- Make sure that you include the complete trend and some of the overall rankings.
1. In Singapore in 2000, males spent around 7.5 years in school and females were at 5.5. 2. This difference of 2 years remained nearly identical over the period as the numbers for males rose steadily to over 9 to finish the period and women had narrowed the gap slightly to just under 8 years.
- Begin with the first chart and include all the data.
- Be sure to compare the data and cover the beginning and end of the period.
1. Turning to the types of schooling, in 2000 most students were in secondary school (27.7%) which was 1.2% higher than college, 3.7% more than those studying for diplomas and well above university degrees at 21.8%. 2. By 2010, university degrees had surged to 44.5% and secondary declined to 8%. 3. College students also made up a smaller proportion at 16.3%, while diploma students rose by about a third to 31.2%.
- Move on to the pie charts and describe the data.
- I worte about the years separately but you could combine the years and write about how they rose from …. to ….
- Finish with all the data and double check the accuracy of your data and your general overview.
Vocabulary
What do the words in bold below mean?
The bar chart records how long students spent in school by gender in two year intervals from 2000 to 2010, while the pie charts break down where they were studying. In general, both males and females saw steady rises in years spent at school, though male figures were always higher. In 2000, there were largely equal proportions for secondary, college, diplomas and university degrees but by 2010 university had more students, largely at the expense of secondary school.
In Singapore in 2000, males spent around 7.5 years in school and females were at 5.5. This difference of 2 years remained nearly identical over the period as the numbers for males rose steadily to over 9 to finish the period and women had narrowed the gap slightly to just under 8 years.
Turning to the types of schooling, in 2000 most students were in secondary school (27.7%) which was 1.2% higher than college, 3.7% more than those studying for diplomas and well above university degrees at 21.8%. By 2010, university degrees had surged to 44.5% and secondary declined to 8%. College students also made up a smaller proportion at 16.3%, while diploma students rose by about a third to 31.2%.
Answers
records details
gender male or female
two year intervals every 2 years, two year gaps
break down are made up of
in general overall
steady rises consistent increases
figures numbers
largely equal proportions mostly the same percentages
secondary high school
college an institute of higher learning
diplomas certificates
university higher education
largely at the expense of mostly because of
spent put time into
difference gap
remained nearly identical over the period were mostly the same for that time
rose steadily increased consistently
narrowed the gap slightly reduced the difference a little
just under a little less than
turning to the types of schooling considering what kind of school
higher more than
well above a lot over
surged increased a lot
declined decreased
made up constituted
smaller proportion lower percentage
rose increased
a third 33%
Pronunciation
ˈrɛkɔːdz
ˈʤɛndə
tuː jɪər ˈɪntəvəlz
breɪk daʊn
ɪn ˈʤɛnərəl
ˈstɛdi ˈraɪzɪz
ˈfɪgəz
ˈlɑːʤli ˈiːkwəl prəˈpɔːʃənz
ˈsɛkəndəri
ˈkɒlɪʤ
dɪˈpləʊməz
ˌjuːnɪˈvɜːsɪti
ˈlɑːʤli æt ði ɪksˈpɛns ɒv
spɛnt
ˈdɪfrəns
rɪˈmeɪnd ˈnɪəli aɪˈdɛntɪkəl ˈəʊvə ðə ˈpɪərɪəd
rəʊz ˈstɛdɪli
ˈnærəʊd ðə gæp ˈslaɪtli
ʤʌst ˈʌndə
ˈtɜːnɪŋ tuː ðə taɪps ɒv ˈskuːlɪŋ
ˈhaɪə
wɛl əˈbʌv
sɜːʤd
dɪˈklaɪnd
meɪd ʌp
ˈsmɔːlə prəˈpɔːʃən
rəʊz
ə θɜːd
Vocabulary Practice
Remember and fill in the blanks:
The bar chart r____________s how long students spent in school by g__________r in t____________________s from 2000 to 2010, while the pie charts b_______________n where they were studying. I______________l, both males and females saw s_______________s in years spent at school, though male f___________s were always higher. In 2000, there were l__________________________s for s________________y, c___________e, d_____________s and u_____________y degrees but by 2010 university had more students, l_______________________f secondary school.
In Singapore in 2000, males s___________t around 7.5 years in school and females were at 5.5. This d______________e of 2 years r___________________________________d as the numbers for males r___________________y to over 9 to finish the period and women had n_____________________________y to j______________r 8 years.
T_______________________________g, in 2000 most students were in secondary school (27.7%) which was 1.2% h________r than college, 3.7% more than those studying for diplomas and w__________e university degrees at 21.8%. By 2010, university degrees had s____________d to 44.5% and secondary d___________d to 8%. College students also m__________p a s______________________n at 16.3%, while diploma students r_______e by about a__________d to 31.2%.
Listening Practice
Learn about Singapore’s schooling system below:
Reading Practice
Read more about the eduation gap between men and women below:
Speaking Practice
Answer the following questions from the real IELTS speaking exam related to study:
Studying
- Are you studying or working?
- Do you prefer to learn in the morning or in the evening?
- What subject do like to study best?
Writing Practice
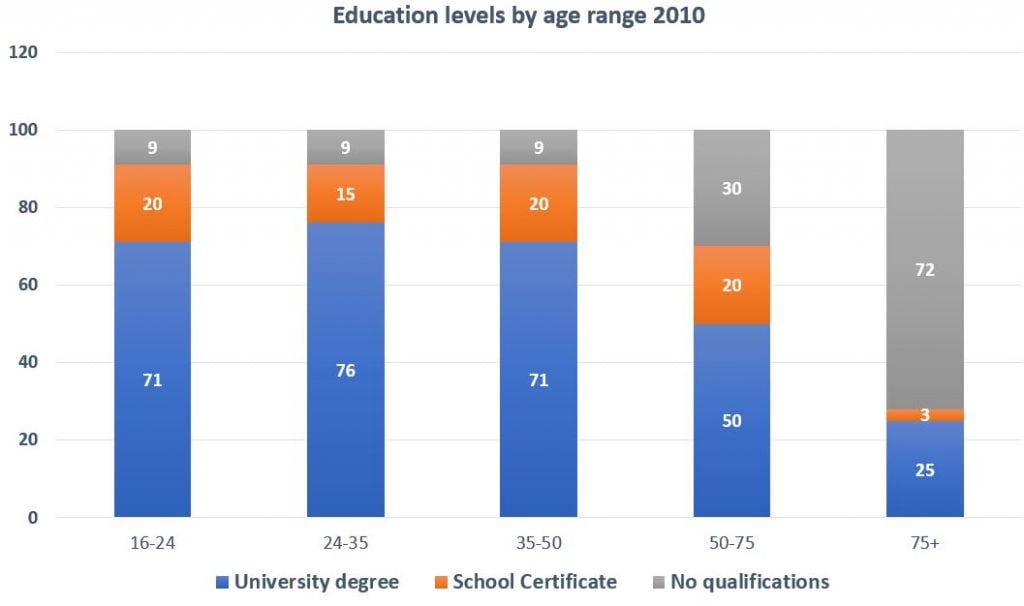
Write about the related graph below about education levels by age range in the UK and then check with my sample answer:


Hello Dave, here is my answer, can you evaluate it. I was surprised that i finished 212 words in almost 20 minutes. Thank you for this amazing website.
The bar chart records the years spent at school between male and female adults in the intervals from 2000 to 2010. Furthermore, the pie charts illustrate the percentage of the highest achievements they have got in the years 2000 and 2010.
Overall, male adults tend to study more years in comparison with female adults. Moreover, more adults achieve university degrees as their highest achievement than they did before and less students obtained a secondary school certificate than before.
It is clear that the number of years spent at the school had gradually increased for both male and female adults where the male adult spent more years (7.5 years) than female adults (5.5 years) where the difference is 2 years in the year 2000. However, female adults, although still spending less years than male adults, had a slight increase in the numbers of years spent, 9.5 for males and 8.5 for females in 2010.
According to the pie charts, in 2000, more adults achieved secondary school certificates as their highest achievement followed by collage, diploma and university degree (27.7%, 26.5%, 24%, and 21.8% respectively.). However, in 2010, the number of adults achieving a university degree had almost doubled, reaching 44.5% followed by diploma with 31.2%, college with 16.3% and secondary school with 8%.
Great work on the timinig first of all!
Your overview has to cover all the areas – not just select a couple of main ones – to reach above band 5 for task achievement. So unfortunately your task achievement score is capped at 5 right away!
Try not to use ‘where’ twice in a sentence (or at all, since it is a slightly odd construction).
Good description of the data!
The bar chart illustrates how long students spent in school by genders and the pie graph depicts their greatest qualifications between the year 2000 and 2010 in Singapore.
Overall, male students spent the most years on studying compared to the female students. Both groups has shown an upward trajectory. In addition, at the beginning of the period, secondary students was the most significant sector.On the other hand, at the end of period, university degree became the largest segment.
In the year 2000, males spent approximately 7.5 years while females spent around 5.5 years. The difference of 2 years maintained identical. As the male adults increased to roughly over 9 years and the female adults to 8. The gap between the two groups has been tighten.
In terms of schooling, in the year 200, high school makes the largest proportion of the total (27.7%) and outraced college at 1.2%, 3.7% greater than those who are studying for diploma and much higher than university degree at 21.8%. Within ten years, university degree skyrocketed to 31.2%, whereas college students made up a smaller percentage at 16.3%
Well done, Mychaela!
You covered everything in your overview and you describe the data well.
There are a lot of small mistakes with present perfect and your verbs in particular.
thank you for the feedback. Can you point out my mistakes and tell me what band score will i get, please?
by point out i mean can you show me how to correct and avoid repeating the same mistake, please? I am currently aiming for band 7 or higher
Sure Mychaela, but I do that as a service that you can order here: course.howtodoielts.com/band-scores-corrections
The bar chart presents how long students spent in school according to gender from 2000 to 2010, while the pie charts shows the breakdown of their attendance per educational level. As an overview, there was a steady increase in the number of both male and female students from 2000 to 2010, although male students spent longer years in school compared to female students. In 2000, there were equal proportions o f students’ attendance per educational level with secondary school as the highest. However, by 2010, a surge of students were perceived in universities, colleges,and diploma levels as a result in the decline of attendance in secondary schools.
In 2000, males spent 7.5 years in school, while women spent 5.5 years at school —two (2) years less than male students.This two-year difference trend continued until 2010 with male students’ years in school reaching nine (9) years while women only spent seven (7) years in the academe.
In 2000, there were equal proportions of students per educational level but secondary school has the highest attendance at 27.7%. However, in 2010, there was a drastic decrease in students’ attendance in secondary schools dropping more than half from 27.7% to only 8%. Consequently, student’s attendance in university degrees doubled from 21.8% to 44.5%, while diploma and college experienced a 7.2% and 10.2% increase of students’ attendance from 2000 to 2010.
Great, Claire!
The overview is too long and detailed though – keep it to two shorter sentences.