This is an IELTS writing task 1 sample answer essay on the topic of British Emigration to selected destinations from 2004 – 2007 (presented in a bar chart).
For my exclusive sample answer PDFs, sign up for my Patreon here.
Dave
IELTS Task 1 Essay: British Emigration

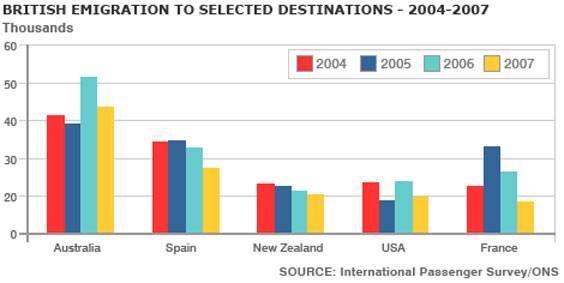
The bar chart provides information comparing emigration out of the UK to 5 countries. Looking from an overall perspective, it is readily apparent that emigration to Australia was most common throughout the period. Besides Australia, all countries saw decreases in the number of British immigrants.
The countries accepting the most British were Australia and Spain, with the former beginning at over 40,000 in 2004, dipping slightly in 2005, before a surge to over 50,000 in 2006, and a fall back to around 44,000 by the end of the period. In contrast, the latter started at around 34,000, rose imperceptibly the next year, and then declined steadily to finish at under 30,000 in 2007.
The other countries generally remained below 30,000 British emigrants, beginning with New Zealand (falling at steady intervals from 23,000 to 21,000 in 2007) and the USA , which decreased steeply from the same starting point to under 20,000 in 2005, more than recovering to 24,000 and then declining again to 20,000. In France, there was a sharp uptick of 10,000 emigrants to 33,000 in the first year before a precipitous fall to under 20,000, the lowest figure for all nations.
Analysis
1. The bar chart provides information comparing emigration out of the UK to 5 countries. 2. Looking from an overall perspective, it is readily apparent that emigration to Australia was most common throughout the period. 3. Besides Australia, all countries saw decreases in the number of British immigrants.
- Paraphrase the overall essay topic.
- Write a general overview that covers all the main trends.
- Make sure everything is covered – aim for a 2 setence overview.
1. The countries accepting the most British were Australia and Spain, with the former beginning at over 40,000 in 2004, dipping slightly in 2005, before a surge to over 50,000 in 2006, and a fall back to around 44,000 by the end of the period. 2. In contrast, the latter started at around 34,000, rose imperceptibly the next year, and then declined steadily to finish at under 30,000 in 2007.
- Begin to include the data.
- Compare different countries to each other.
1. The other countries generally remained below 30,000 British emigrants, beginning with New Zealand (falling at steady intervals from 23,000 to 21,000 in 2007) and the USA , which decreased steeply from the same starting point to under 20,000 in 2005, more than recovering to 24,000 and then declining again to 20,000. 2. In France, there was a sharp uptick of 10,000 emigrants to 33,000 in the first year before a precipitous fall to under 20,000, the lowest figure for all nations.
- Describe the rest of the data.
- Make sure all countries have been covered in full.
Vocabulary
What do the words in bold below mean?
The bar chart provides information comparing emigration out of the UK to 5 countries. Looking from an overall perspective, it is readily apparent that emigration to Australia was most common throughout the period. Besides Australia, all countries saw decreases in the number of British immigrants.
The countries accepting the most British were Australia and Spain, with the former beginning at over 40,000 in 2004, dipping slightly in 2005, before a surge to over 50,000 in 2006, and a fall back to around 44,000 by the end of the period. In contrast, the latter started at around 34,000, rose imperceptibly the next year, and then declined steadily to finish at under 30,000 in 2007.
The other countries generally remained below 30,000 British emigrants, beginning with New Zealand (falling at steady intervals from 23,000 to 21,000 in 2007) and the USA , which decreased steeply from the same starting point to under 20,000 in 2005, more than recovering to 24,000 and then declining again to 20,000. In France, there was a sharp uptick of 10,000 emigrants to 33,000 in the first year before a precipitous fall to under 20,000, the lowest figure for all nations.
Answers
provides information illustrates
emigration leaving to live in another country
looking from an overall perspective, it is readily apparent that overall
most common happened the most
throughout the period over the whole graph time period
besides also
saw underwent
immigrants people who have left their country
accepting allowing in
with first of all
former country mentioned before
dipping slightly falling a little
surge increase a lot
fall back decrease
by the end of the period by 2007
in contrast in comparison
latter country mentioned second
imperceptibly barely noticeably
declined steadily decreased at steady intervals
finish done, complete
generally remained below overall was under
beginning with starting with
falling at steady intervals decreasing steadily
decreased steeply fell quickly
more than recovering getting back to the numbers from before and more
declining again decreasing a second time
sharp uptick increase quickly
precipitous fall steep decrease
lowest figure for all nations low point for all countries
Pronunciation
prəˈvaɪdz ˌɪnfəˈmeɪʃən
ˌɛmɪˈgreɪʃən
ˈlʊkɪŋ frɒm ən ˈəʊvərɔːl pəˈspɛktɪv, ɪt ɪz ˈrɛdɪli əˈpærənt ðæt
məʊst ˈkɒmən
θru(ː)ˈaʊt ðə ˈpɪərɪəd
bɪˈsaɪdz
sɔː
ˈɪmɪgrənts
əkˈsɛptɪŋ
wɪð
ˈfɔːmə
ˈdɪpɪŋ ˈslaɪtli
sɜːʤ
fɔːl bæk
baɪ ði ɛnd ɒv ðə ˈpɪərɪəd
ɪn ˈkɒntrɑːst
ˈlætə
ˌɪmpəˈsɛptəbli
dɪˈklaɪnd ˈstɛdɪli
ˈfɪnɪʃ
ˈʤɛnərəli rɪˈmeɪnd bɪˈləʊ
bɪˈgɪnɪŋ wɪð
ˈfɔːlɪŋ æt ˈstɛdi ˈɪntəvəlz
diːˈkriːst ˈstiːpli
mɔː ðæn rɪˈkʌvərɪŋ
dɪˈklaɪnɪŋ əˈgɛn
ʃɑːp ʌptɪk
prɪˈsɪpɪtəs fɔːl
ˈləʊɪst ˈfɪgə fɔːr ɔːl ˈneɪʃənz
Vocabulary Practice
Remember and fill in the blanks:
The bar chart p________________________n comparing e______________n out of the UK to 5 countries. L____________________________________________________________t emigration to Australia was m_________________n t_____________________d. B_________s Australia, all countries s___w decreases in the number of British i________________s.
The countries a_____________g the most British were Australia and Spain, w______h the f_________r beginning at over 40,000 in 2004, d________________y in 2005, before a s________e to over 50,000 in 2006, and a f__________k to around 44,000 b__________________________d. I____________t, the l_________r started at around 34,000, rose i___________________y the next year, and then d_____________________y to f__________h at under 30,000 in 2007.
The other countries g______________________w 30,000 British emigrants, b______________________h New Zealand (f___________________________s from 23,000 to 21,000 in 2007) and the USA , which d_____________________y from the same starting point to under 20,000 in 2005, m_______________________g to 24,000 and then d___________________n to 20,000. In France, there was a s________________k of 10,000 emigrants to 33,000 in the first year before a p___________________l to under 20,000, the l____________________________s.
Listening Practice
Learn about immigration to Britain here:
Reading Practice
Learn more about migration trends on the BBC here:
https://www.bbc.co.uk/bitesize/guides/z8x6wxs/revision/3
Speaking Practice
Practice your speaking with these related questions from the real IELTS exam:
Where you Live
- Have you lived for a long time in your current city?
- What kind of a home are you living in?
- How could your living area be improved?
Writing Practice
Write about the following graph then check with my sample answer:


Hi Dave, can you please evaluate my essay, please? I would also like to know the band score as well.
The bar chart depicts the number of British emigrants in chosen countries in the year 2004 to 2007.
Overall, Australia has the most British emigrants throughout the period, while the remaining destinations experienced a downward trend.
The countries accepting the most British emigrants were Australia and Spain. At the beginning of the year, Australia’s British emigrants were a little over 40,000, dropping slightly below 40,000 in 2005, then skyrocketing to over 50,00 the following year, and lastly plummeted to approximately 44,000 by the end of the period. On the other hand, Spain started off with around 35,000, rose marginally the next year, and decreasing steadily and ended under 30,000 in the year 2007.
The rest of the countries remained under 30,000 in general. New Zealand accepted around 24,000 emigrants, and had a gradual decrease throughout the years, ending with roughly 20,000 in 2007. America had almost 24,000 emigrants at the beginning, then dipping significantly in 2005, before a surge to about 24,000 and a fall back to 20,000 line in 2007. Finally with France, in 2004, the figures were nearly 23,000, reaching its highest point at almost 33,000, then took a plunge the next two years, hitting a low point of under 20,000.
Good work, Mychaela!
For full feedback and scores, you can sign up here: course.howtodoielts.com/band-scores-corrections