Nowadays, distance-learning programs have gained in popularity, but some people argue that online courses can never be taken as good as those taken at a college or university in person.
To what extent do you agree or disagree?
The rise in popularity of online-learning software and applications has led many to argue they can be as effective as real-life lessons taken at university. In my opinion, though these lessons are more efficient in particular university situations, their overall efficacy is far lower than learning in person.
Proponents of online study point out how increased flexibility leads to greater efficiency. When students study in person, they must expend time traveling to and from class and waiting before and after the lesson. In the aggregate, this constitutes significant time lost. This time could be redirected into more studying or other tasks. For instance, a student studying online could finish assignments up until the minute class begins and quickly begin their homework after the lesson. However, the efficiency gained is largely hypothetical as most students are likely to become distracted during online lessons and waste much of the time saved online.
Moreover, in-person lessons are far more engaging than online ones. This was clearly evidenced during the recent Covid-19 pandemic when many schools, including universities, transitioned to online learning for a period of time. The results were that students were generally less engaged in lessons and their overall productivity and learning suffered. This counterintuitive loss of productivity can be explained not only by the potential distractions students are vulnerable to online but also by the lack of connection between learners and teachers. In a classroom setting, students personally interact with their professors and other students, guaranteeing a high level of engagement and memorability.
In conclusion, though there are reasons to argue for the potential time saved through online lessons, they are simply far less effective than real world classes. Online lessons should remain a niche element of a university education.
Analysis
1. The rise in popularity of online-learning software and applications has led many to argue they can be as effective as real-life lessons taken at university. 2. In my opinion, though these lessons are more efficient in particular university situations, their overall efficacy is far lower than learning in person.
Paraphrase the overall essay topic.
Write a clear opinion. Read more about introductions here.
1. Proponents of online study point out how increased flexibility leads to greater efficiency. 2. When students study in person, they must expend time traveling to and from class and waiting before and after the lesson. 3. In the aggregate, this constitutes significant time lost. This time could be redirected into more studying or other tasks. 4. For instance, a student studying online could finish assignments up until the minute class begins and quickly begin their homework after the lesson. 5. However, the efficiency gained is largely hypothetical as most students are likely to become distracted during online lessons and waste much of the time saved online.
Write a topic sentence with a clear main idea at the end.
Explain your main idea.
Develop it with specific or hypothetical examples.
Keep developing it fully.
You might add a counterpoint here.
1. Moreover, in-person lessons are far more engaging than online ones. 2. This was clearly evidenced during the recent Covid-19 pandemic when many schools, including universities, transitioned to online learning for a period of time. 3. The results were that students were generally less engaged in lessons and their overall productivity and learning suffered. 4. This counterintuitive loss of productivity can be explained not only by the potential distractions students are vulnerable to online but also by the lack of connection between learners and teachers. 5. In a classroom setting, students personally interact with their professors and other students, guaranteeing a high level of engagement and memorability.
Write a new topic sentence with a new main idea at the end.
Explain your new main idea.
Include specific details and examples.
Add as much information as you can and make sure it links logically.
Continue your development.
1. In conclusion, though there are reasons to argue for the potential time saved through online lessons, they are simply far less effective than real world classes. 2. Online lessons should remain a niche element of a university education.
Summarise your main ideas.
Include a final thought. Read more about conclusions here.
Vocabulary
What do the words in bold below mean?Make some notes on paper to aid memory and then check below.
The rise in popularity ofonline-learning software and applications has led many to argue they can be as effective as real-life lessons taken at university. In my opinion, though these lessons are more efficient in particular university situations, their overall efficacy is far lower than learning in person.
Proponents of online study point out how increased flexibility leads to greater efficiency. When students study in person, they must expend time traveling to and from class and waiting before and after the lesson. In the aggregate, this constitutes significant time lost. This time could be redirected into more studying or other tasks. For instance, a student studying online could finish assignments up until the minute class begins and quickly begin their homework after the lesson. However, the efficiency gained is largely hypothetical as most students are likely to become distracted during online lessons and waste much of the time saved online.
Moreover, in-person lessons are far more engaging than online ones. This was clearly evidenced during the recent Covid-19 pandemic when many schools, including universities, transitioned to online learning for a period of time. The results were that students were generally less engaged in lessons and their overall productivity and learning suffered. This counterintuitive loss of productivity can be explained not only by the potential distractions students are vulnerable to online but also by the lack of connection between learners and teachers. In a classroom setting, students personally interact with their professors and other students, guaranteeing a high level of engagement and memorability.
In conclusion, though there are reasons to argue for the potential time saved through online lessons, they are simply far less effective than real world classes. Online lessons should remain a niche element of a university education.
Answers
For extra practice, write an antonym (opposite word) on a piece of paper to help you remember the new vocabulary:
The rise in popularity ofonline-learning software and applications using apps like Zoom more often
argue point out
as effective as real-life lessons taken at university just as good as the classes in college
efficient saving time and money
particular university situations some cases
overall efficacy is far lower than learning in person generally worse than learning in real life
Proponents of online study point out how increased flexibility leads to greater efficiency supporters of remote learning argue it is more convenient and saves time and energy
expend time traveling to and from waste time commuting
waiting before and after the lesson hanging out before and after classes
In the aggregate combined
constitutes significant time lost combines all the time not used
redirected put in a different direction
tasks assignments
finish assignments up until the minute class begins do work right until class starts
quickly begin their homework after the lesson do homework as soon as class ends
gained what you get
largely hypothetical just imaginary
distracted during online lessons not paying attention during classes online
waste much of the time saved online not productively use your time
in-person lessons studying in real life
This was clearly evidenced during the recent Covid-19 pandemic when clearest example of this was during the Coronavirus pandemic
transitioned to moved to
for a period of time over some time
results consequences
generally less engaged in overall not as interested in
overall productivity and learning suffered general efficiency and learning got worse
counterintuitive not what you would assume, not logical
can be explained not only by the potential distractions students are vulnerable to online but also by there’s an explanation that students might be wasting time online and not paying attention
lack of connection between not much link to
In a classroom setting in classes
personally interact with in person communicate with
guaranteeing safeguarding
high level of engagement and memorability makes it more interesting and easy to remember
argue for the potential time saved through point out it saves time
far less effective than real world classes much less valuable than in-person lessons
remain a niche element keep it a small part of the course
I recommend getting a pencil and piece of paper because that aids memory. Then write down the missing vocabulary from my sample answer in your notebook:
T___________________________________________________s has led many to a________e they can be a___________________________________________________y. In my opinion, though these lessons are more e____________t in p_________________________________s, their o_________________________________n.
P______________________________________________________________________________y. When students study in person, they must e__________________________m class and w_______________________________n. I_______________e, this c__________________________________t. This time could be r__________d into more studying or other t_____s. For instance, a student studying online could f________________________________________s and q_______________________________________________________n. However, the efficiency g________d is l__________________l as most students are likely to become d_______________________________s and w____________________________________e.
Moreover, i_____________s are far more engaging than online ones. T__________________________________________________________________n many schools, including universities, t___________________o online learning f_____________________e. The r________s were that students were g_____________________n lessons and their o_____________________________________d. This c_________________e loss of productivity c______________________________________________________________________________________y the l__________________________n learners and teachers. I_________________________g, students p__________________________h their professors and other students, g__________________________________________________________y.
In conclusion, though there are reasons to a_________________________________________h online lessons, they are simply f___________________________________________s. Online lessons should r________________________t of a_________________________n.
Listening Practice
Learn more about this topic by watching from YouTube below and practice with these activities:
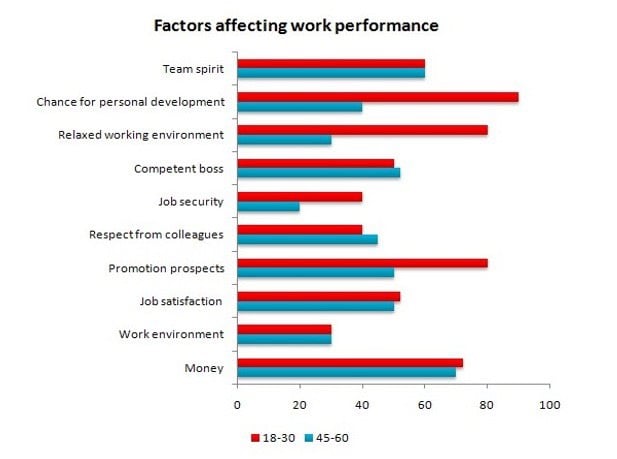
The bar chart shows the factors that most affect work performance at a given company by age group. Looking from an overall perspective, it is readily apparent that there is general congruity in terms of the factors, though younger employees value promotion prospects, opportunities for personal development, and a relaxed working environment more highly. For both age groups, salary and team spirit were important and work environment and job security tended to be less impactful.
In terms of the categories with greater similarity, for both ages, 60% consider team spirit important and 30% think the environment impacts their work performances. The reported figures are also similar for job satisfaction (55% for those aged 18-30 and 50% for those 45-60), respect from colleagues (38% for younger workers and 42% for their older counterparts), money (73% for younger employees and 70% for older ones), and competent bosses (near 50% for both).
There is significant contrast in terms of how much chances for personal growth affect work with 90% for employees aged 18-30 and just 38% for older workers. Similarly, younger people place greater emphasis on a relaxed working environment (85% to 30%), job security (40% to 20%), and advancement prospects (80% to approximately 48%).
Analysis
1. The bar chart shows the factors that most affect work performance at a given company by age group. 2. Looking from an overall perspective, it is readily apparent that there is general congruity in terms of the factors, though younger employees value promotion prospects, opportunities for personal development, and a relaxed working environment more highly. 3. For both age groups, salary and team spirit were important and work environment and job security tended to be less impactful.
Paraphrase what the bar chart shows.
Write a clear overview summarising the differences.
This one is a little complex so it needs a second sentence for the overview.
1. In terms of the categories with greater similarity, for both ages, 60% consider team spirit important and 30% think the environment impacts their work performances. 2. The reported figures are also similar for job satisfaction (55% for those aged 18-30 and 50% for those 45-60), respect from colleagues (38% for younger workers and 42% for their older counterparts), money (73% for younger employees and 70% for older ones), and competent bosses (near 50% for both).
Begin writing about the data for the first categories.
There is a lot of data so this essay is a little longer than normal.
1. There is significant contrast in terms of how much chances for personal growth affect work with 90% for employees aged 18-30 and just 38% for older workers. 2. Similarly, younger people place greater emphasis on a relaxed working environment (85% to 30%), job security (40% to 20%), and advancement prospects (80% to approximately 48%).
Write about the final other parts of the graph – include everything!
Compare the categories.
Vocabulary
What do the words in bold below mean?Make some notes on paper to aid memory and then check below.
The bar chart shows the factors that most affect work performanceat a given company by age group. Looking from an overall perspective, it is readily apparent that there is general congruity in terms of the factors, though younger employees value promotion prospects, opportunities for personal development, and a relaxed working environment more highly. For both age groups, salary and team spirit were important and work environment and job security tended to be lessimpactful.
In terms of the categories with greater similarity, for both ages, 60% consider team spirit important and 30% think the environment impacts their work performances. The reported figures are also similar for job satisfaction (55% for those aged 18-30 and 50% for those 45-60), respect from colleagues (38% for younger workers and 42% for their older counterparts), money (73% for younger employees and 70% for older ones), and competent bosses (near 50% for both).
There is significant contrast in terms of how much chances for personal growth affect work with 90% for employees aged 18-30 and just 38% for older workers. Similarly, younger people place greater emphasis on a relaxed working environment (85% to 30%), job security (40% to 20%), and advancement prospects (80% to approximately 48%).
Answers
For extra practice, write an antonym (opposite word) on a piece of paper to help you remember the new vocabulary:
factors elements that go into influencing something
affect work performanceat a given company by age group impact how people work at a company according to how old they are
Looking from an overall perspective, it is readily apparent that overall
general congruity in terms of about the same concerning
younger employees value promotion prospects people who are not as old care more about advancing
opportunities for personal development changes to grow individually
relaxed working environment not a tense place to work
For both age groups concerning each demographic
salary how much money you make
team spirit morale
work environment where you work, the office, the atmosphere, etc.
job security tended to be lessimpactful not worrying about getting fired was less influential
In terms of the categories with greater similarity concerning the brackets that were almost the same
consider think about
work performances how well you do at your job
reported figures the data
respect from colleagues how valued you are by co-workers
older counterparts older employees
competent bosses good managers
There is significant contrast in terms of big differences when it comes to
personal growth how you change as a person
Similarly about the same
place greater emphasis on care more about
job security not worrying about getting fired
advancement prospects chances to get promotions and move up in the company
I recommend getting a pencil and piece of paper because that aids memory. Then write down the missing vocabulary from my sample answer in your notebook:
The bar chart shows the f______s that most a_____________________________________________________p. L__________________________________________________________t there is g_______________________f the factors, though y______________________________________________s, o_______________________________________t, and a r___________________________________t more highly. F________________________s, s_______y and t__________t were important and w__________________t and j_________________________________l.
I____________________________________________y, for both ages, 60% c________r team spirit important and 30% think the environment impacts their w__________________________s. The r____________________s are also similar for job satisfaction (55% for those aged 18-30 and 50% for those 45-60), r___________________s (38% for younger workers and 42% for their o_______________________s), money (73% for younger employees and 70% for older ones), and c______________s (near 50% for both).
T_____________________________________________f how much chances for p______________h affect work with 90% for employees aged 18-30 and just 38% for older workers. S_________y, younger people p_______________________n a relaxed working environment (85% to 30%), j________________y (40% to 20%), and a____________________s (80% to a________________y 48%).
Listening Practice
Learn more about this topic by watching from YouTube below and practice with these activities:
Some people believe that car-free days are effective ways to reduce air pollution. However, others argue that there are other ways that are more effective.
Discuss both views and give your own opinion.
Many today feel that designated car-free days are the optimal method to reduce rising levels of air pollution. In my opinion, despite other viable options, car-free days would be the best remedy.
Critics of this policy argue that governments could instead create laws related to industrial production. Except for automobiles, the main causes of air pollution are resource mining, consumer electronics manufacturing, and textile fabrication. If governments legislated strict controls on production methods, there would be a concomitant decline in air pollution figures. For instance, in many European nations, companies have limited carbon emissions thresholds they can utilize in production and exceeding these numbers results in heavy fines and other penalties. This forward-looking solution is also appealing since it would encompass the entire calendar year, whereas car-free days are more limited in their scope.
However, car-free days would have greater impact due to their far-reaching implications. Firstly, banning cars would massively reduce air pollution figures since cars contribute more harmful gases into the atmosphere than any single industry. Secondly, banning cars would force motorists to find alternative modes of transportation that might then become habits. A person who cannot drive to work once a week, may consider working at home or utilizing public transport. If they find these options more efficient, then they may willingly abandon using their car on other days. Over time, this could begin to shift mindsets in society and individuals might become less obsessed with car ownership as a symbol of wealth and success and start prioritizing efficiency and a cleaner environment.
In conclusion, though regulation of particular industries would also aid in the reduction of air pollution, the banning of automobiles on certain days is the single best solution. Governments should consider implementing and expanding existing policies that prohibit private vehicles.
Analysis
1. Many today feel that designated car-free days are the optimal method to reduce rising levels of air pollution. 2. In my opinion, despite other viable options, car-free days would be the best remedy.
Paraphrase the overall essay topic.
Write a clear opinion. Read more about introductions here.
1. Critics of this policy argue that governments could instead create laws related to industrial production. 2. Except for automobiles, the main causes of air pollution are resource mining, consumer electronics manufacturing, and textile fabrication. 3. If governments legislated strict controls on production methods, there would be a concomitant decline in air pollution figures. 4. For instance, in many European nations, companies have limited carbon emissions thresholds they can utilize in production and exceeding these numbers results in heavy fines and other penalties. 5. This forward-looking solution is also appealing since it would encompass the entire calendar year, whereas car-free days are more limited in their scope.
Write a topic sentence with a clear main idea at the end.
Explain your main idea.
Develop it with specific or hypothetical examples.
Keep developing it fully.
You can sometimes include the counterpoint here too.
1. However, car-free days would have greater impact due to their far-reaching implications. 2. Firstly, banning cars would massively reduce air pollution figures since cars contribute more harmful gases into the atmosphere than any single industry. 3. Secondly, banning cars would force motorists to find alternative modes of transportation that might then become habits. 4. A person who cannot drive to work once a week, may consider working at home or utilizing public transport. 5. If they find these options more efficient, then they may willingly abandon using their car on other days. 6. Over time, this could begin to shift mindsets in society and individuals might become less obsessed with car ownership as a symbol of wealth and success and start prioritizing efficiency and a cleaner environment.
Write a new topic sentence with a new main idea at the end.
Explain your new main idea.
Include specific details and examples.
Add as much information as you can and make sure it links logically.
Continue your development.
Use a variety of grammar.
1. In conclusion, though regulation of particular industries would also aid in the reduction of air pollution, the banning of automobiles on certain days is the single best solution. 2. Governments should consider implementing and expanding existing policies that prohibit private vehicles.
Summarise your main ideas.
Include a final thought. Read more about conclusions here.
Vocabulary
What do the words in bold below mean?Make some notes on paper to aid memory and then check below.
Many today feel that designated car-free days are the optimal method to reduce rising levels of air pollution. In my opinion, despite other viable options, car-free days would be the best remedy.
Critics of this policy argue that governments could instead create laws related to industrial production. Except for automobiles, the main causes of air pollution are resource mining, consumer electronics manufacturing, and textile fabrication. If governments legislated strict controls on production methods, there would be a concomitant decline in air pollution figures. For instance, in many European nations, companies have limited carbon emissionsthresholds they can utilize in production and exceeding these numbers results in heavy fines and other penalties. This forward-looking solution is also appealing since it would encompass the entire calendar year, whereas car-free days are more limited in their scope.
However, car-free days would have greater impact due to their far-reaching implications. Firstly, banning cars would massively reduce air pollution figures since cars contribute more harmful gases into the atmosphere than any single industry. Secondly, banning cars would force motorists to find alternative modes of transportation that might then become habits. A person who cannot drive to work once a week, may consider working at home or utilizing public transport. If they find these options more efficient, then they may willingly abandon using their car on other days. Over time, this could begin to shift mindsets in society and individuals might become less obsessed with car ownership as a symbol of wealth and success and start prioritizing efficiency and a cleaner environment.
In conclusion, though regulation of particular industries would also aid in the reduction of air pollution, the banning of automobiles on certain days is the single best solution. Governments should consider implementing and expanding existing policies that prohibit private vehicles.
Answers
For extra practice, write an antonym (opposite word) on a piece of paper to help you remember the new vocabulary:
designated car-free days days when you are not allowed to drive your car
optimal method to reduce rising levels of air pollution best way to cut down on lack of fresh air
despite other viable options regardless of other good choices
remedy solution
Critics of this policy argue people who are against this idea
instead create laws related to industrial production better to limit pollution from companies
Except for automobiles with the exception of cars
main causes primary sources
resource mining getting materials like coal out of the Earth
consumer electronics manufacturing making products like iPhones
textile fabrication making clothing
legislated strict controls on production methods make laws to regulate manufacturing
concomitant decline in air pollution figures related fall in numbers for unclean air
limited carbon emissionsthresholds only a certain amount you can add to the air
exceeding these numbers results in heavy fines and other penalties going above these figures means you have to pay or receive other punishments
This forward-looking solution is also appealing since the long-term fix is good because
encompass include
entire calendar year whole year
whereas instead of
limited in their scope doesn’t encompass everything
greater impact due to their far-reaching implications more effect because of repercussions
massively reduce air pollution hugely cut down on unclean air
harmful gases into the atmosphere than any single industry air pollution caused by one field
force motorists make drivers
alternative modes of transportation different ways of getting around
habits what you do every day
may consider working at home or utilizing public transport might work remotely or take buses, the metro, etc.
efficient doesn’t waste time or energy
willingly abandon of their own choice stop using
Over time in the long-term
begin to shift mindsets in society start to change how people think and act
individuals might become less obsessed with car ownership as a symbol of wealth and success people might not care as much about how cars boost their self-esteem
start prioritizing efficiency and a cleaner environment care more about saving time and energy and being good for nature
aid in help
on certain days on particular days
consider implementing and expanding existing policies that prohibit private vehicles think about putting in place laws to ban cars
I recommend getting a pencil and piece of paper because that aids memory. Then write down the missing vocabulary from my sample answer in your notebook:
Many today feel that d_______________________________s are the o____________________________________________________s o_______________________n. In my opinion, d____________________________s, car-free days would be the best r________y.
C___________________e that governments could i__________________________________n. E_________________________s, the m________________s of air pollution are r_____________g, c_____________________________________g, and t________________n. If governments l___________________________________________s, there would be a c________________________________________________s. For instance, in many European nations, companies have l________________________________________s they can utilize in production and e_______________________________________________________________s. T_______________________________________________e it would e____________s the e________________r, w___________s car-free days are more l_________________e.
However, car-free days would have g_________________________________________s. Firstly, banning cars would m________________________________n figures since cars contribute more h_________________________________________________________y. Secondly, banning cars would f_________________s to find a____________________________________________n that might then become h_______s. A person who cannot drive to work once a week, m_____________________________________________________t. If they find these options more e_________t, then they may w___________________n using their car on other days. O_________e, this could b__________________________________y and i___________________________________________________________________________s and s__________________________________________________t.
In conclusion, though regulation of particular industries would also a_____n the reduction of air pollution, the banning of automobiles o_____________________s is the single best solution. Governments should c___________________________________________________________________s.
Listening Practice
Learn more about this topic by watching from YouTube below and practice with these activities:
"The highest quality materials anywhere on the internet! Dave improved my writing and vocabulary so much. Really affordable options you don't want to miss out on!"