
Writing a general overview for task 1 on IELTS is one of the most essential skills on the whole exam.
In fact, the overivew may be the most important single sentence or two that you will write because of the massive impact that it has on your score.
Check out my EBooks here on Patreon.com/howtodoielts.
You can read all my sample answers with complete overviews here as well: https://howtodoielts.com/ielts-writing-task-1/
Let me know if you have questions in the comments below!
Dave
What is an IELTS General Overview?
An IELTS general overview is usually the second sentence of your task 1 writing and it should give an overview of what the graph shows in general.
Before an overview, usually you will write a sentence like ‘The chart shows the figures for sales of bananas’ – this is not the overview.
The overview is the next 1 or 2 sentences where you explain what is generally happening.
For example: ‘Overall, sales of bananas increased in India and Vietnam but fell in China. The most bananas were still consistently sold in China throughout the period.’
That’s it!
Sounds simple but when you start actually writing them, they get really, really tricky!
If you don’t have one (or you make a mistake with it) then you are limited to a maximum of band 5 for task achievement.
What should I not include in my general overview?
Do not include any opinion or speculation (such as the reason why banana sales increased or your opinion about bananas).
Do not include any of the data (such as sales increased to more than 12 million) – the data is for later in the essay.
What should I include?
It depends a lot on the type of graph – there is no one answer that applies to every graph.
For graphs that show time – it is the trend, the speend and a ranking.
For graphs without time – it is a comparison and ranking.
For processes – it is a grouping and description.
For maps – it is also a grouping and description.
So let’s take a look at what each one requires!
How do I write the overview for a line graph / graph that shows time?
Here is my simple rule (from my online courses) for writing the general overview for line graphs (or pie charts, bar charts, and tables that show change over time):
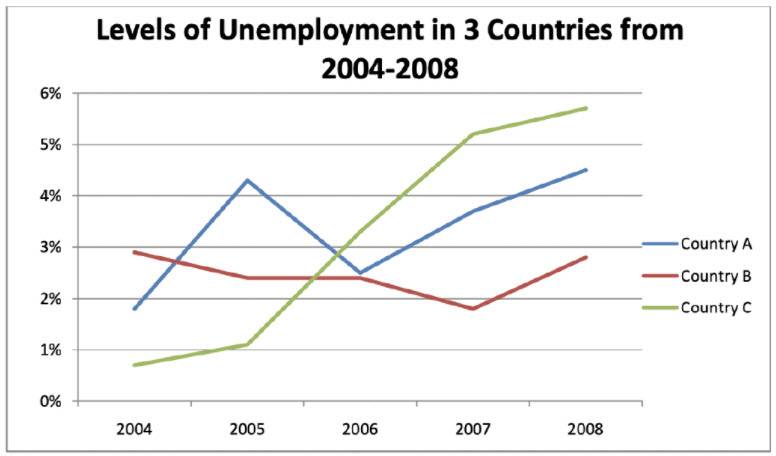
TSR: Trend, Speed, and Ranking
Write that at the top of your paper and make sure that you include the trend, the speed and the ranking for the graph or chart.
For example:

Here is the chart for that overview:
The most important of the 3 is the trend.
Make sure you have 100% of 100% of the categories.
Forget a category or don’t state the trend for one area and you will be stuck at band 5 for task achievement no matter how perfect the rest of your essay is.
How do I write the overview for graphs and charts that don’t show time?
If a graph does not show time, then there is no trend and you are simply doing a ranking and comparison.
Just like the overview above, you must include all areas.
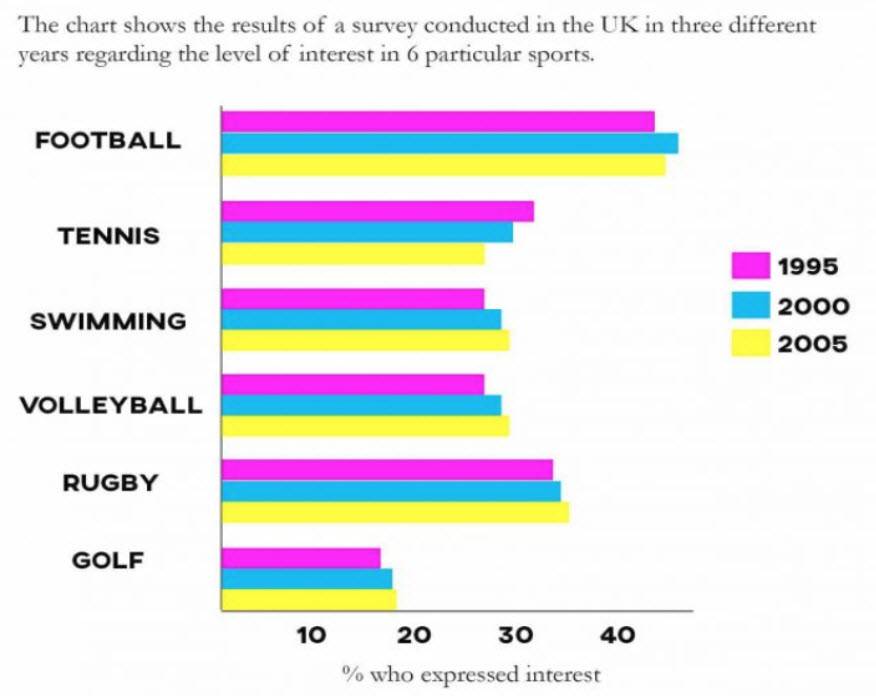
For instance:
Looking from an overall perspective, it is readily apparent that cars are more popular in the UK, the US and especially Italy while the French prefer to ride bicycles. In all countries except the United States, motorcycles are the least common option.

The key with these is to include all areas – don’t miss out on anything!
You can read here about the common mistake students make when writing overviews for table.
How do I write the overview for a process?
An overview for a process is totally different!
For a process, you must group and describe the major changes.
In the process below, that would look like this:
Looking from an overall perspective, it is readily apparent that there are 3 main steps to this entirely man-made process beginning with initial transportation of the raw material to the factory, followed by preparation and processing of the material, and finally the production of consumer products.

Students will often include the number of steps – that is fine, you can do that, but it is not really important for the overview.
The other mistake that students often make is just listing a couple of steps but not defining/describing them in any way.
They must be grouped together and described or it will not count as an overview.
How do I write the overview for a map?
The IELTS overviews for maps are similar to processes.
Group and describe.
For example:
Looking from an overall perspective, it is readily apparent that the town became more residential, commercial, and accessible at the expense of natural land, agriculture and smaller shops.

The big mistake students make with maps is that they sometimes use words that are too close to being opinion.
For instance, you can’t say that a town or floorplan has become more comfortable or more convenient – that is too close to being an opinion.
But you can use words like more/less: residential, natural, populated, modern, tourist-friendly, accessible, developed, industrial, etc.
Those ones are descriptive – they do not give an opinion about how people feel about the place.
Student Examples
I now recommend reading through this PDF so you can see my comments on an actual student overviews:
Feel free to comment your own overviews for the chart below too:


ਕਿਰਪਾ ਕਰਕੇ ਮੈਨੂ task one intro and overview de sample send kardi plz dear