Around the world, rural people are moving to cities and urban areas, so populations in the countryside are decreasing.
Is this a positive or negative development?
It is becoming increasingly common for residents to concentrate in urban areas, rather than the countryside. In my opinion, this is a decidedly negative phenomenon for human society as a whole despite the economic benefits.
Those who support the current prioritization of city life point out how it positively impacts the workforce. When the majority of a population is concentrated, this makes it easier for businesses to operate. For example, in cities such as Tokyo, there are millions of residents in the city itself and the outlying districts. The people support restaurants, cinemas, malls, arcades, parks, and various other recreational areas. These businesses in turn provide jobs for locals and this creates a positive feedback loop and greatly enriches the quality of life for the average person living in a big city. The best evidence for this is the number of people willing to move to cities for superior employment options.
However, the drawbacks associated with city lifestyles are more significant. In past generations, there was greater diversity in terms of where residents lived that enabled more varied lifestyle options. People living in the country were more likely to work outdoors and possess skills related to farming, hunting, and raising livestock. Today, most people live in cities and work corporate jobs and are experts in terms of marketing, finance, business, and customer service. These industries have a place in a healthy society but should not predominate over healthier, more active forms of gainful employment. As the world continues to transition to online-based jobs, the situation will only worsen.
In conclusion, although there are legitimate economic arguments to be made for urban migration, I would argue the effects on how humans live are overwhelmingly negative. Governments should therefore implement policies to encourage more rural infrastructure and economic activity.
Analysis
1. It is becoming increasingly common for residents to concentrate in urban areas, rather than the countryside. 2. In my opinion, this is a decidedly negative phenomenon for human society as a whole despite the economic benefits.
Paraphrase the overall essay topic.
Write a clear opinion. Read more about introductions here.
1. Those who support the current prioritization of city life point out how it positively impacts the workforce. 2. When the majority of a population is concentrated, this makes it easier for businesses to operate. 3. For example, in cities such as Tokyo, there are millions of residents in the city itself and the outlying districts. 4. The people support restaurants, cinemas, malls, arcades, parks, and various other recreational areas. 5. These businesses in turn provide jobs for locals and this creates a positive feedback loop and greatly enriches the quality of life for the average person living in a big city. 6. The best evidence for this is the number of people willing to move to cities for superior employment options.
Write a topic sentence with a clear main idea at the end.
Explain your main idea.
Develop it with specific or hypothetical examples.
Keep developing it fully.
Vary long and short sentences.
Finish strong.
1. However, the drawbacks associated with city lifestyles are more significant. 2. In past generations, there was greater diversity in terms of where residents lived that enabled more varied lifestyle options. 3. People living in the country were more likely to work outdoors and possess skills related to farming, hunting, and raising livestock. 4. Today, most people live in cities and work corporate jobs and are experts in terms of marketing, finance, business, and customer service. 5. These industries have a place in a healthy society but should not predominate over healthier, more active forms of gainful employment. 6. As the world continues to transition to online-based jobs, the situation will only worsen.
Write a new topic sentence with a new main idea at the end.
Explain your new main idea.
Include specific details and examples.
Add as much information as you can and make sure it links logically.
Keep adding…
Finish the paragraph with even more detail.
1. In conclusion, although there are legitimate economic arguments to be made for urban migration, I would argue the effects on how humans live are overwhelmingly negative. 2. Governments should therefore implement policies to encourage more rural infrastructure and economic activity.
Summarise your main ideas.
Include a final thought. Read more about conclusions here.
Vocabulary
What do the words in bold below mean?Make some notes on paper to aid memory and then check below.
It is becoming increasingly common for residents to concentrate in urban areas, rather than the countryside. In my opinion, this is a decidedly negative phenomenon for human society as a whole despite the economic benefits.
Those who support the current prioritization of city life point out how it positively impacts the workforce. When the majority of a population is concentrated, this makes it easier for businesses to operate. For example, in cities such as Tokyo, there are millions of residents in the city itself and the outlying districts. The people support restaurants, cinemas, malls, arcades, parks, and various other recreational areas. These businesses in turn provide jobs for locals and this creates a positive feedback loop and greatly enriches the quality of life for the average person living in a big city. The best evidence for this is the number of people willing to move to cities for superior employment options.
However, the drawbacks associated with city lifestyles are more significant. In past generations, there was greater diversity in terms of where residents lived that enabled more varied lifestyle options. People living in the country were more likely to work outdoors and possess skills related to farming, hunting, and raising livestock. Today, most people live in cities and work corporate jobs and are experts in terms of marketing, finance, business, and customer service. These industries have a place in a healthy society but should not predominate over healthier, more active forms of gainful employment. As the world continues to transition to online-based jobs, the situation will only worsen.
In conclusion, although there are legitimate economic arguments to be made for urban migration, I would argue the effects on how humans live are overwhelmingly negative. Governments should therefore implement policies to encourage more rural infrastructure and economic activity.
Answers
For extra practice, write an antonym (opposite word) on a piece of paper to help you remember the new vocabulary:
It is becoming increasingly common for residents more and more people today are
concentrate focus on
urban areas cities
rather than instead of
countryside rural areas
decidedly negative phenomenon for human society as a whole despite the economic benefits definitely bad for all people in general regardless of how it helps the economy
Those who support the current prioritization of city life point out the people in favor of living in cities argue
positively impacts the workforce helps people in terms of jobs
the majority of a most of
makes it easier for is not as hard to
operate work in that area
residents people living there
outlying districts suburbs
arcades places to play games
various other recreational areas lots of other things to do for fun
in turn provide as a result give
locals people living in that area
creates a positive feedback loop benefits everyone
greatly enriches the quality of life for the average person makes life better for people
The best evidence for this is the strongest case is
willing to will do it
superior employment options better job choices
the drawbacks associated with the downsides related to
lifestyles how people live
significant meaningful
In past generations before
greater diversity in terms of lots of different people concerning
enabled more varied lifestyle options allowed for different ways of living
work outdoors and possess skills related to farming, hunting, and raising livestock not office jobs and can do agricultural work
work corporate jobs work in an office
experts in terms of marketing, finance, business, and customer service good at advertising and economics and selling things
have a place in a healthy society there is room for them
predominate are most common
healthier better for you
more active forms of gainful employment less passive ways of earning money
transition to online-based jobs change to jobs on computers and the internet
worsen not get better
legitimate economic arguments to be made for strong financial points that can be argued for
migration moving to
overwhelmingly negative very bad
implement policies to encourage more rural infrastructure and economic activity create laws to improve living in the countryside
I recommend getting a pencil and piece of paper because that aids memory. Then write down the missing vocabulary from my sample answer in your notebook:
I___________________________________________s to c_________e in u_________s, r__________n the c__________e. In my opinion, this is a d_________________________________________________________________________________________________s.
T____________________________________________________________________t how it p________________________________e. When t________________a population is concentrated, this m________________________r businesses to o_______e. For example, in cities such as Tokyo, there are millions of r_______s in the city itself and the o______________s. The people support restaurants, cinemas, malls, a__________s, parks, and v________________________s. These businesses i______________e jobs for l_____s and this c____________________________________p and g________________________________________________n living in a big city. T_____________________s the number of people w___________o move to cities for s_________________________s.
However, t__________________________h city l__________s are more s_________t. I____________s, there was g_______________________f where residents lived that e_________________________________s. People living in the country were more likely to w_____________________________________________________________________________k. Today, most people live in cities and w______________s and are e________________________________________________________________________e. These industries h___________________________y but should not p___________e over h________r, m______________________________t. As the world continues to t_________________________________s, the situation will only w______n.
In conclusion, although there are l_____________________________r urban m_________n, I would argue the effects on how humans live are o________________e. Governments should therefore i_______________________________________________________________________________y.
Listening Practice
Learn more about this topic by watching from YouTube below and practice with these activities:
Many people believe that it is easier to have a healthy lifestyle in the countryside. Other believe that there are health benefits to living in cities.
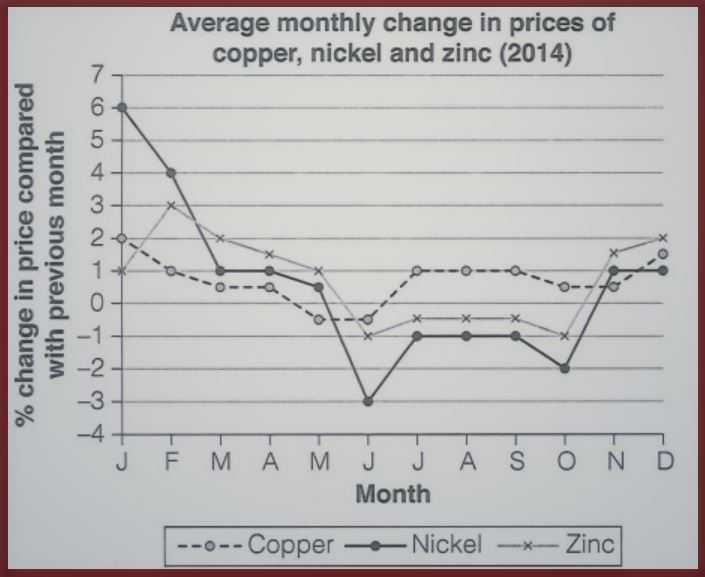
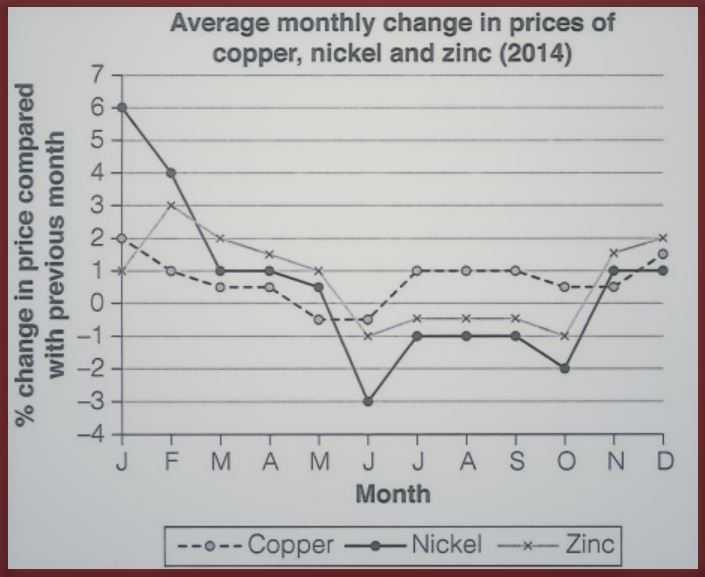
This is an IELTS writing task 1 sample answer essay from the new IELTS Cambridge 18 book of past tests on the topic of average monthly change in a line chart showing copper, nickel, and zinc prices.
IELTS Cambridge 18: Average Monthly Change Line Chart
The line chart gives information about the change in monthly prices for copper, nickel and zinc over the course of 2014. Overall, there were declines for the prices of copper and especially nickel, and a moderate rise for zinc. By the end of the period, the changes had become less extreme and nickel clearly experienced the greatest month-to-month volatility.
In January of 2014, the percentage change for nickel based on the previous month was 6%, by far higher than copper (2%) and zinc (1%). This trend reversed for nickel with the percentage changes dropping to 1% by March and a low of -3% by June. The divergences for the other minerals were more moderate with a high of a 3% change for zinc in February before a declining trend over the remainder of the first half of the year. Copper prices similarly fell but were grouped slightly lower around 1% to -1%.
In the second half of the year, nickel production declined (-1% over most months) before a sharp rise to finish the year with 1% increases. Copper, in contrast, hovered near 1% from July onwards with a slight uptick in December. Zinc was marginally lower with .5% drops for the majority of the latter part of the year, prior to a surge to finish with a 2% rise in December, the highest ending point among all mineral prices.
Analysis
1. The line chart gives information about the change in monthly prices for copper, nickel and zinc over the course of 2014. 2. Overall, there were declines for the prices of copper and especially nickel, and a moderate rise for zinc. 3. By the end of the period, the changes had become less extreme and nickel clearly experienced the greatest month-to-month volatility.
Paraphrase what the bar chart shows.
Write a clear overview summarising the differences and the overall trend.
This one is a little complex so it needs a second sentence for the overview.
1. In January of 2014, the percentage change for nickel based on the previous month was 6%, by far higher than copper (2%) and zinc (1%). 2. This trend reversed for nickel with the percentage changes dropping to 1% by March and a low of -3% by June. 3. The divergences for the other minerals were more moderate with a high of a 3% change for zinc in February before a declining trend over the remainder of the first half of the year. 4. Copper prices similarly fell but were grouped slightly lower around 1% to -1%.
Begin writing about the data for the first categories.
Compare between each sentence.
Add as much detail as possible.
This essay is a bit long – aim for about 175 words.
1. In the second half of the year, nickel production declined (-1% over most months) before a sharp rise to finish the year with 1% increases. 2. Copper, in contrast, hovered near 1% from July onwards with a slight uptick in December. 3. Zinc was marginally lower with .5% drops for the majority of the latter part of the year, prior to a surge to finish with a 2% rise in December, the highest ending point among all mineral prices.
Write about the final other parts of the graph – include everything!
Compare the categories.
Better to include all the data than be too short!
Vocabulary
What do the words in bold below mean?Make some notes on paper to aid memory and then check below.
The line chart gives information about the change in monthly prices for copper, nickel and zinc over the course of 2014. Overall, there were declines for the prices of copper and especially nickel, and a moderate rise for zinc. By the end of the period, the changes had become less extreme and nickel clearly experienced the greatest month-to-month volatility.
In January of 2014, the percentage change for nickel based on the previous month was 6%, by far higher than copper (2%) and zinc (1%). This trend reversed for nickel with the percentage changes dropping to 1% by March and a low of -3% by June. The divergences for the other minerals were more moderatewith a high of a 3% change for zinc in February before a declining trendover the remainder of the first half of the year. Copper prices similarly fell but were grouped slightly lower around 1% to -1%.
In the second half of the year, nickel production declined (-1% over most months) before a sharp rise to finish the year with 1% increases. Copper, in contrast, hovered near 1% from July onwards with a slight uptick in December. Zinc was marginally lower with .5% drops for the majority of the latter part of the year, prior to a surge to finish with a 2% rise in December, the highest ending point among all mineral prices.
Answers
For extra practice, write an antonym (opposite word) on a piece of paper to help you remember the new vocabulary:
gives information about shows
copper a mineral used for making wire
nickel a mineral for making coins
zinc a healthy mineral
over the course of during the entire time
Overall in general
declines goes down
moderate rise small increase
less extreme not as big
clearly experienced the greatest month-to-month volatility definitely changed a lot more each month
based on the previous month from the month before
by far higher than much more than
This trend reversed for this pattern went the other way in terms of
dropping to falling to
a low of low point of
divergences differences
more moderatewith a high of a not as extreme with a top level of
before a declining trendover the remainder of the first half of the year prior to a falling pattern for the rest of the year
similarly fell also decreased
grouped slightly lower around all less at close to
In the second half of the year after July
declined went down
before a sharp rise to finish the year with prior to a surge to end at
in contrast however
hovered near was around
from … onwards starting here and going to here
a slight uptick a little increase
marginally lower with a little less
drops falls
the majority of the latter part of the year most of the rest of the year
prior to a surge to finish with before a big increase to end at
highest ending point among all mineral prices the biggest number for all categories
I recommend getting a pencil and piece of paper because that aids memory. Then write down the missing vocabulary from my sample answer in your notebook:
The line chart g________________t the change in monthly prices for c_______r, n_____l and z___c o__________________f 2014. O______l, there were d______s for the prices of copper and especially nickel, and a m___________e for zinc. By the end of the period, the changes had become l___________e and nickel c___________________________________________________________________________________________y.
In January of 2014, the percentage change for nickel b_______________________h was 6%, b______________n copper (2%) and zinc (1%). T_______________r nickel with the percentage changes d___________o 1% by March and a_______f -3% by June. The d_________s for the other minerals were m___________________________________a 3% change for zinc in February b__________________________________________________________________r. Copper prices s__________l but were g_______________________________d 1% to -1%.
I____________________________r, nickel production d_________d (-1% over most months) b____________________________________h 1% increases. Copper, i_________t, h___________r 1% f___m July o_________s with a____________k in December. Zinc was m__________________h .5% d_____s for t_________________________________________________r, p_________________________h a 2% rise in December, the h___________________________________s.
Listening Practice
Learn more about this topic by watching from YouTube below and practice with these activities:
This is an IELTS writing task 2 sample answer essay from the new IELTS Cambridge 18 book of past tests on the topic of the most important aim of science.
IELTS Cambridge 18: The Most Important Aim of Science
The most important aim of science ought to be to improve people’s lives.
To what extent do you agree or disagree?
Some have argued the most crucial aim of science is to improve the lives of ordinary people. In my opinion, though science might have grander aims at times, this simple goal is in fact its primary purpose.
Those who contend that science is not simply a means to improving ordinary life point out scientific inquiry can be a goal in itself. Many scientists do not imagine how their discoveries will benefit the general populace and are instead concerned with discovery and exploration. A standout example of this would be the theories of Charles Darwin, which had little immediate practical purpose other than to understand the origins of the human species. For the average researcher, concentrating solely on learning more about the natural world is a valid and potentially productive mindset. However, this interpretation of science does not reflect the real-world demands placed on science.
Historically, science has always been a platform to improve the daily lives of average individuals. This can be understood in a number of different senses. In terms of medicine, procedures and pharmaceuticals are designed with the explicit purpose of lengthening and elevating quality of life. When it comes to technology, science can be seen as subordinate to the arts and the enjoyment of the average person. The entire purpose of developing technologies such as mobile phones and computers is to allow users to listen to music, watch movies and televisions shows, edit their own videos, engage in word processing, and so on. Therefore, the highest aim of science is ultimately only to provide humans with the means to express themselves and reach others.
In conclusion, since improving life can be interpreted widely, it is decidedly the main aim of science. Those who argue for a more idealistic interpretation are not considering the pragmatism that should be the foundation of all scientific endeavor.
Analysis
1. Some have argued the most crucial aim of science is to improve the lives of ordinary people. 2. In my opinion, though science might have grander aims at times, this simple goal is in fact its primary purpose.
Paraphrase the overall essay topic.
Write a clear opinion. Read more about introductions here.
1. Those who contend that science is not simply a means to improving ordinary life point out scientific inquiry can be a goal in itself. 2. Many scientists do not imagine how their discoveries will benefit the general populace and are instead concerned with discovery and exploration. 3. A standout example of this would be the theories of Charles Darwin, which had little immediate practical purpose other than to understand the origins of the human species. 4. For the average researcher, concentrating solely on learning more about the natural world is a valid and potentially productive mindset. 5. However, this interpretation of science does not reflect the real-world demands placed on science.
Write a topic sentence with a clear main idea at the end.
Explain your main idea.
Develop it with specific or hypothetical examples.
Keep developing it fully.
Vary long and short sentences.
1. Historically, science has always been a platform to improve the daily lives of average individuals. 2. This can be understood in a number of different senses. In terms of medicine, procedures and pharmaceuticals are designed with the explicit purpose of lengthening and elevating quality of life. 3. When it comes to technology, science can be seen as subordinate to the arts and the enjoyment of the average person. 4. The entire purpose of developing technologies such as mobile phones and computers is to allow users to listen to music, watch movies and televisions shows, edit their own videos, engage in word processing, and so on. 5. Therefore, the highest aim of science is ultimately only to provide humans with the means to express themselves and reach others.
Write a new topic sentence with a new main idea at the end.
Explain your new main idea.
Include specific details and examples.
Add as much information as you can and make sure it links logically.
Finish the paragraph strong.
1. In conclusion, since improving life can be interpreted widely, it is decidedly the main aim of science. 2. Those who argue for a more idealistic interpretation are not considering the pragmatism that should be the foundation of all scientific endeavor.
Summarise your main ideas.
Include a final thought. Read more about conclusions here.
Vocabulary
What do the words in bold below mean?Make some notes on paper to aid memory and then check below.
Some have argued the most crucial aim of science is to improve the lives of ordinary people. In my opinion, though science might have grander aims at times, this simple goal is in fact its primary purpose.
Those who contend that science is not simply a means to improving ordinary life point out scientific inquiry can be a goal in itself. Many scientists do not imagine how their discoveries will benefit the general populace and are instead concerned with discovery and exploration. A standout example of this would be the theories of Charles Darwin, which had little immediate practical purpose other than to understand the origins of the human species. For the average researcher, concentrating solely on learning more about the natural world is a valid and potentially productive mindset. However, this interpretation of science does not reflect the real-world demands placed on science.
Historically, science has always been a platform to improve the daily lives of average individuals. This can be understood in a number of different senses. In terms of medicine, procedures and pharmaceuticals are designed with the explicit purpose of lengthening and elevating quality of life. When it comes to technology, science can be seen as subordinate to the arts and the enjoyment of the average person. The entire purpose of developingtechnologies such as mobile phones and computers is to allow users to listen to music, watch movies and televisions shows, edit their own videos, engage in word processing, and so on. Therefore, the highest aim of science is ultimately only to provide humans with the means to express themselves and reach others.
In conclusion, since improving life can be interpreted widely, it is decidedly the main aim of science. Those who argue for a more idealistic interpretation are not considering the pragmatism that should be the foundation of all scientific endeavor.
Answers
For extra practice, write an antonym (opposite word) on a piece of paper to help you remember the new vocabulary:
argued made the point that
most crucial aim of science key goal of chemistry, biology, technology, physics, astronomy, engineering, etc.
improve the lives of ordinary people make average people have better lives
grander aims at times bigger goals sometimes
simple goal basic aim
in fact actually
primary purpose real reason for it
Those who contend that the people who argue that
improving ordinary life making life better for normal people
scientific inquiry learning about and researching through science
goal in itself no other goal needed
imagine think of
discoveries what they uncover about the world, inventions
general populace people
instead concerned with discovery and exploration in fact caring about learning
A standout example of this would be a clear instance of this is
theories ideas about the world
little immediate practical purpose no real effect in the real world to start
the origins of the human species where people came from, evolution
average researcher a normal scientist
concentrating solely on focusing just on
natural of course
valid and potentially productive mindset legitimate and possible useful way of seeing the world
interpretation of way of seeing something
reflect the real-world demands placed on science show the actual way science exists in the world
Historically in the past
platform place for
daily lives of average individuals how normal people live, standard of living
This can be understood in a number of different senses there’s more than one way to interpret this
In terms of medicine when it comes to health
procedures operations
pharmaceuticals drugs
designed with the explicit purpose of lengthening and elevating quality of life made just to help people living longer and live better
When it comes to concerning
subordinate to the arts serve artistic purposes
The entire purpose of developingtechnologies the only reason to have different kinds of tech
users people using services such as websites
edit their own videos cut up movies
engage in word processing write things
and so on etc.
Therefore thus
the highest aim of the best goal of
ultimately only in the end just
express themselves be artistic
reach distribute to the world at large
interpreted widely understand in many ways, broadly
decidedly definitely
main aim of science the primary reason to do science
more idealistic interpretation lofty way of seeing it
considering given that
pragmatism related to being practical, real life
foundation basis
scientific endeavor learning about and practicing science
I recommend getting a pencil and piece of paper because that aids memory. Then write down the missing vocabulary from my sample answer in your notebook:
Some have a_________d the m_______________________________e is to i________________________________________e. In my opinion, though science might have g______________________s, this s________________l is i_________t its p_______________________e.
T______________________________t science is not simply a means to i_____________________e point out s____________________y can be a g______________f. Many scientists do not i________-_e how their d____________s will benefit the g_______________e and are i___________________________________n. A_________________________________e the t_________s of Charles Darwin, which had l_______________________________e other than to understand t___________________________s. For the a______________________r, c_________________________-n learning more about the n___________l world is a v_____________________________________________________t. However, this i_________________f science does not r_______________________________________________e.
H_______________y, science has always been a p________m to improve the d____________________________s. T__________________________________________________________________s. I_______________________e, p___________s and p_______________s are d____________________________________________________________________________e. W________________o technology, science can be seen as s______________________s and the enjoyment of the average person. T____________________________________________s such as mobile phones and computers is to allow u_______s to listen to music, watch movies and televisions shows, e_______________________s, e__________________________g, a___________n. T__________e, t________________f science is u_______________y to provide humans with the means to e____________________s and r_______h others.
In conclusion, since improving life can be i_________________y, it is d____________y the m____________________e. Those who argue for a m____________________________n are not c_______________g the p_____________m that should be the f_______________n of all s__________________r.
Listening Practice
Learn more about this topic by watching from YouTube below and practice with these activities:
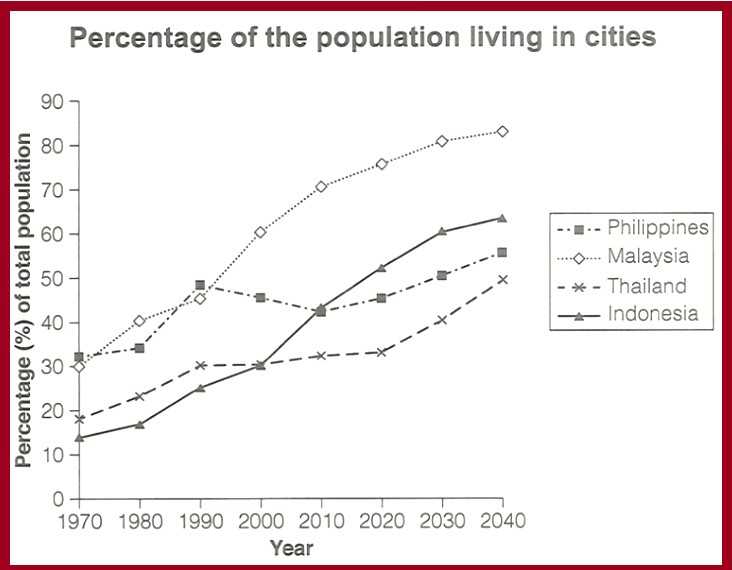
This is an IELTS writing task 1 sample answer essay from the new IELTS Cambridge 18 book of past tests on the topic of the population in four Asian countries from 1970 to 2040.
IELTS Cambridge 18: Population in Four Asian Countries
The graph gives information about the percentage of the population if four different Asian countries living in cities between 1970 and 2020 with additional predictions for 2030 and 2040.
Summarize the information by selecting and reporting the main features and making comparisons where relevant.
The line chart delineates population trends as they relate to urban residency in four Asian countries starting in 1970 with projections through 2040. Looking from an overall perspective, it is readily apparent that living in urban areas will increase in each nation, particularly Malaysia and the Philippines. By the end of the period, Malaysia will have by far the greatest proportion of their population living in cities.
In 1970, the percentages for urban residents in the Philippines and Malaysia were nearly equal (31% and 30% for each), similar to the data for Thailand and Indonesia (19% and 12%, respectively). Over the next twenty years, Malaysia’s percentage rose and fluctuated, switching relative positions with the Philippines around the 40% marker before beginning a dramatic surge in 1990 that is anticipated to continue and plateau at just over 80% by 2040. The Philippines, in contrast, declined moderately after 1980, though this figure will likely recover and end at a high of above 50% in 2040.
The statistics for urban residency in Indonesia have grown considerably, overtaking Thailand in 2000 (at 28%) and the Philippines in 2010 (at 42%). This pattern is projected to persist with the final figure the second highest among all nations at 55%. Lastly, Thailand has experienced the most gradual and consistent increase to reach approximately 30% in the present day, with a more rapid rise to over 40% expected over the next 17 years.
Analysis
1. The line chart delineates population trends as they relate to urban residency in four Asian countries starting in 1970 with projections through 2040. 2. Looking from an overall perspective, it is readily apparent that living in urban areas will increase in each nation, particularly Malaysia and the Philippines. 3. By the end of the period, Malaysia will have by far the greatest proportion of their population living in cities.
Paraphrase what the bar chart shows.
Write a clear overview summarising the differences and the overall trend.
This one is a little complex so it needs a second sentence for the overview.
1. In 1970, the percentages for urban residents in the Philippines and Malaysia were nearly equal (31% and 30% for each), similar to the data for Thailand and Indonesia (19% and 12%, respectively). 2. Over the next twenty years, Malaysia’s percentage rose and fluctuated, switching relative positions with the Philippines around the 40% marker before beginning a dramatic surge in 1990 that is anticipated to continue and plateau at just over 80% by 2040. 3. The Philippines, in contrast, declined moderately after 1980, though this figure will likely recover and end at a high of above 50% in 2040.
Begin writing about the data for the first categories.
Compare between each sentence.
Add as much detail as possible.
1. The statistics for urban residency in Indonesia have grown considerably, overtaking Thailand in 2000 (at 28%) and the Philippines in 2010 (at 42%). 2. This pattern is projected to persist with the final figure the second highest among all nations at 55%. 3. Lastly, Thailand has experienced the most gradual and consistent increase to reach approximately 30% in the present day, with a more rapid rise to over 40% expected over the next 17 years.
Write about the final other parts of the graph – include everything!
Compare the categories.
This one is a bit long, but better than being too short!
Vocabulary
What do the words in bold below mean?Make some notes on paper to aid memory and then check below.
The line chart delineates population trends as they relate tourban residency in four Asian countries starting in 1970 with projections through 2040. Looking from an overall perspective, it is readily apparent that living in urban areas will increase in each nation, particularly Malaysia and the Philippines. By the end of the period, Malaysia will have by far the greatest proportion of their population living in cities.
In 1970, the percentages for urban residents in the Philippines and Malaysia were nearly equal (31% and 30% for each), similar to the data for Thailand and Indonesia (19% and 12%, respectively). Over the next twenty years, Malaysia’s percentage rose and fluctuated, switching relative positions with the Philippines around the 40% marker before beginning a dramatic surge in 1990 that is anticipated to continue and plateau at just over 80% by 2040. The Philippines, in contrast, declined moderately after 1980, though this figure will likely recover and end at a high of above 50% in 2040.
The statistics for urban residency in Indonesia have grown considerably, overtaking Thailand in 2000 (at 28%) and the Philippines in 2010 (at 42%). This pattern is projected to persist with the final figure the second highest among all nations at 55%. Lastly, Thailand has experienced the most gradual and consistent increase to reach approximately 30% in the present day, with a more rapid rise to over 40% expected over the next 17 years.
Answers
For extra practice, write an antonym (opposite word) on a piece of paper to help you remember the new vocabulary:
delineates shows
population trends the pattern for the number of people in a country
relate to concern
urban residency people living in cities
starting in beginning
with projections through showing predictions for the future
Looking from an overall perspective, it is readily apparent that overall
urban areas cities
particularly especially
By the end of the period at the end of the time surveyed
by far the greatest proportion of their population living in cities a lot higher than the percentages for people living in cities in other countries
nearly equal about the same
respectively in turn, for each
rose grew
fluctuated was erratic, not stable
switching relative positions changing which one is leading
marker before beginning a dramatic surge in level prior to starting to grow quickly
anticipated to continue and plateau at just over predicted to keep going and level off at above
in contrast in comparison
declined moderately after went down a bit after
though however
will likely recover will probably come back up
end at a high of above finish at a high point over
statistics numbers
urban residency people living in cities
grown considerably increased a lot
overtaking getting bigger than
pattern trend
projected to persist predicted to continue
the final figure the ending number
among all covering all the countries
Lastly finally
experienced witnessed, underwent
most gradual and consistent increase slowest and steadiest rise
I recommend getting a pencil and piece of paper because that aids memory. Then write down the missing vocabulary from my sample answer in your notebook:
The line chart d____________s p__________________s as they r_________ou_______________y in four Asian countries s____________n 1970 w___________________h 2040. L______________________________________________________________t living in u___________s will increase in each nation, p__________y Malaysia and the Philippines. B________________d, Malaysia will have b___________________________________________________________________________s.
In 1970, the percentages for urban residents in the Philippines and Malaysia were n__________l (31% and 30% for each), similar to the data for Thailand and Indonesia (19% and 12%, r_________y). Over the next twenty years, Malaysia’s percentage r____e and f____________d, s__________________s with the Philippines around the 40% m_______________________________________n 1990 that is a___________________________________________r 80% by 2040. The Philippines, i_______________t, d_____________________________r 1980, t________h this figure w__________________r and e______________________e 50% in 2040.
The s____________s for u________________y in Indonesia have g____________________y, o___________g Thailand in 2000 (at 28%) and the Philippines in 2010 (at 42%). This p___________n is p_________________t with t_____________________e the second highest a____________l nations at 55%. L______y, Thailand has e______________d the m_________________________________e to r___________________y 30% in the present day, with a m________________e to over 40% e___________________t 17 years.
Listening Practice
Learn more about this topic by watching from YouTube below and practice with these activities:
This is my IELTS writing task 2 sample answer essay from the newest IELTS Cambridg 18 book of past tests on the topic of university students and main subjects.
Be sure to sign up for my full IELTS EBooks here to support my efforts to keep writing these essays for students:
IELTS Cambridge 18: University Students and Main Subjects
Many university students want to learn about different subjects in addition to their main subjects. Others feel it is more important to give all their time and attention to studying for their qualification.
Discuss both views and give your opinion.
Many university students are now inclined to divide their time between studying for their major and pursuing interests in unrelated subjects. In my opinion, it is crucial for undergraduates to learn about a wide range of disciplines in order to best prepare themselves for the future.
Those who support prioritizing one’s major argue the importance of specialization. At university, there are a range of potential distractions related to social life and living on one’s own. If a graduate wants to be successful in a future career, the most logical pathway is to prepare diligently in a one specialization. For instance, an undergraduate learning about chemical engineering will be a better potential candidate for well-paid positions if they have acquired a solid theoretical foundation and accumulated whatever practical experience is available in their courses. Any diversions that detract from this focus could hinder their early career progression.
However, it is in fact more valuable long-term to view learning as an interdisciplinary experience. Many graduates will change or at least alter their professions as they begin working. Even those who remain in the same industry will benefit greatly from studying a variety of subjects. The above-mentioned engineer might be able to study about figure drawing outside their main courses and come up with more creative ideas that combine multiple subjects in their main work. Even if the other subjects are not directly applicable to work, at the minimum they are likely to feel they have become a more diverse and well-rounded individual on a personal level.
In conclusion, though time spent on one’s university major can lead to an improved discrete skillset, there is far greater value in possessing a breadth of knowledge. This range of information will serve as the foundation for a potentially more creative and fulfilling career and personal life.
Analysis
1. Many university students are now inclined to divide their time between studying for their major and pursuing interests in unrelated subjects. 2. In my opinion, it is crucial for undergraduates to learn about a wide range of disciplines in order to best prepare themselves for the future.
Paraphrase the overall essay topic.
Write a clear opinion. Read more about introductions here.
1. Those who support prioritizing one’s major argue the importance of specialization. 2. At university, there are a range of potential distractions related to social life and living on one’s own. 3. If a graduate wants to be successful in a future career, the most logical pathway is to prepare diligently in a one specialization. 4. For instance, an undergraduate learning about chemical engineering will be a better potential candidate for well-paid positions if they have acquired a solid theoretical foundation and accumulated whatever practical experience is available in their courses. 5. Any diversions that detract from this focus could hinder their early career progression.
Write a topic sentence with a clear main idea at the end.
Explain your main idea.
Develop it with specific or hypothetical examples.
Keep developing it fully.
Vary long and short sentences.
1. However, it is in fact more valuable long-term to view learning as an interdisciplinary experience. 2. Many graduates will change or at least alter their professions as they begin working. 3. Even those who remain in the same industry will benefit greatly from studying a variety of subjects. 4. The above-mentioned engineer might be able to study about figure drawing outside their main courses and come up with more creative ideas that combine multiple subjects in their main work. 5. Even if the other subjects are not directly applicable to work, at the minimum they are likely to feel they have become a more diverse and well-rounded individual on a personal level.
Write a new topic sentence with a new main idea at the end.
Explain your new main idea.
Include specific details and examples.
Add as much information as you can and make sure it links logically.
Finish the paragraph strong.
1. In conclusion, though time spent on one’s university major can lead to an improved discrete skillset, there is far greater value in possessing a breadth of knowledge. 2. This range of information will serve as the foundation for a potentially more creative and fulfilling career and personal life.
Summarise your main ideas.
Include a final thought. Read more about conclusions here.
Vocabulary
What do the words in bold below mean?Make some notes on paper to aid memory and then check below.
Many university students are now inclined to divide their time between studying for their major and pursuing interests in unrelated subjects. In my opinion, it is crucial for undergraduates to learn about a wide range of disciplines in order to best prepare themselves for the future.
Those who support prioritizing one’s major argue the importance of specialization. At university, there are a range of potential distractions related tosocial life and living on one’s own. If a graduate wants to be successful in a future career, the most logical pathway is to prepare diligently in a one specialization. For instance, an undergraduate learning about chemical engineering will be a better potential candidate for well-paid positions if they have acquired a solid theoretical foundation and accumulated whatever practical experience is available in their courses. Any diversions that detract from this focus could hinder their early career progression.
However, it is in fact more valuable long-term to view learning as an interdisciplinary experience. Many graduates will change or at least alter their professions as they begin working. Even those who remain in the same industry will benefit greatly from studying a variety of subjects. The above-mentioned engineer might be able to study about figure drawing outside their main courses and come up with more creative ideas that combine multiple subjects in their main work. Even if the other subjects are not directly applicable to work, at the minimum they are likely to feel they have become a more diverse and well-rounded individual on a personal level.
In conclusion, though time spent on one’s university major can lead to an improved discrete skillset, there is far greater value in possessing a breadth of knowledge. This range of information will serve as the foundation for a potentially more creative and fulfilling career and personal life.
Answers
For extra practice, write an antonym (opposite word) on a piece of paper to help you remember the new vocabulary:
now inclined to divide their time between studying for their major and these days like to split time on their main subject and other subjects
pursuing interests in unrelated subjects looking into different subject areas
it is crucial for undergraduates important for students at university
wide range of disciplines lots of different subjects
in order to so that
best prepare better get ready for
Those who support prioritizing one’s major argue the people in favor of focusing on just their main subject
importance value
specialization focusing on one area
range of potential distractions related tosocial life lots of possible ways to not focus concerning personal life
living on one’s own not living with parents
successful doing well
most logical pathway clearest way
prepare diligently get ready carefully
chemical engineering working with chemicals to make things
better potential candidate good applicants
well-paid positions good jobs
acquired get
solid theoretical foundation good understanding of the basics of a subject
accumulated whatever practical experience is available in their courses get real-life experience from their classes
diversions distractions
detract distract
focus concentration
hinder their early career progression hurt how well they do in their first job
long-term in the future
view learning see studying
interdisciplinary experience studying lots of different subjects
graduates people who finish school
at least alter at minimum change a it
professions jobs
remain in the same industry stay in the same area
benefit greatly get a lot from
studying a variety of subjects learning lots of areas
above-mentioned engineer worker I talked about before
figure drawing learning to draw people
come up with think of
creative ideas imaginative concepts
multiple many
directly applicable to work can be use at work
at the minimum at least
diverse different
well-rounded overall strong, balanced
on a personal level personally, related to private life
improved discrete skillset better at certain skills
far greater value in more importance from
breadth of knowledge lots of information, knowing about many different subjects
serve as the foundation as the basis for
potentially more creative and fulfilling career and personal life possible a better job and private life
I recommend getting a pencil and piece of paper because that aids memory. Then write down the missing vocabulary from my sample answer in your notebook:
Many university students are n____________________________________________________________d p_____________________n u________________s. In my opinion, i____________________________s to learn about a w____________________s i____________o b_____________e themselves for the future.
T_________________________________________________e the i____________e of s_____________n. At university, there are a r________________________________s r____________os____________e and l___________________n. If a graduate wants to be s___________l in a future career, the m____________________y is to p________________y in a one s______________n. For instance, an undergraduate learning about c_________________________g will be a b_________________________e for w_________________s if they have a___________d a s___________________________n and a_____________________________________________________________s. Any d____________s that d_______t from this f______s could h_______________________________________n.
However, it is in fact more valuable l__________m to v____________g as an i____________________________e. Many g____________s will change or a____________r their p___________s as they begin working. Even those who r________________________________y will b_____________y from s_______________________________s. The a________________________________r might be able to study about f__________________g outside their main courses and c________________h more c___________________s that combine m_________e subjects in their main work. Even if the other subjects are not d________________________k, a________________m they are likely to feel they have become a more d________e and w______________d individual o____________________l.
In conclusion, though time spent on one’s university major can lead to an i__________________________t, there is f________________n possessing a b__________________e. This range of information will s________________________n for a p_____________________________________________________________________e.
Listening Practice
Learn more about this topic by watching from YouTube below and practice with these activities:
"The highest quality materials anywhere on the internet! Dave improved my writing and vocabulary so much. Really affordable options you don't want to miss out on!"