IELTS Writing Task 2 Sample Answer: Personal Energy Consumption (Real IELTS Test)
Scientists have been warning for many years about environmental protection and how important it is to limit our personal energy consumption.
What are the causes of the over-consumption of electricity?
How can people be encouraged to use less energy?
For decades, warnings of incoming climate catastrophe have grown louder and many today are making concerted efforts to limit their carbon footprint. In my opinion, the main cause of over-consumption of electricity is the development of technology and people can be taught to limit their energy usage through strict governmental regulations.
People today use more electricity because technology has pervaded every aspect of life. Several decades ago, electricity was mainly used to power a limited number of household items including lights, televisions and washing machines. It still powers those devices but now there are phones to charge and computers that use electricity throughout the day. People tend to spend more time at home, online with their devices thus using more power. Even the large servers and generators required to power the internet add to the collective electric toll of modern technology.
The best way to cultivate good energy habits is to impose regulations. Government regulations have been a proven remedy in curbing human excess in terms of using plastic bags (bans) and smoking (taxes). This would also work when it comes to energy. One simple solution would be to tax energy use, though this step would have socioeconomic bias built into it. A better approach might be to regulate the energy efficiency of household items. This would target a high percentage of people across all classes and have an easily quantifiable, manageable outcome.
In conclusion, outsized energy consumption is down to technology and governments can regulate to minimise it moving forward. The more effort put into reducing energy use, the more dividends future generations will reap from today’s reforms.
IELTS Sample Answer Analysis
1. For decades, warnings of incoming climate catastrophe have grown louder and many today are making concerted efforts to limit their carbon footprint. 2. In my opinion, the main cause of over-consumption of electricity is the development of technology and people can be taught to limit their energy usage through strict governmental regulations.
Paraphrase the topic of the essay for your first sentence.
Give your opinion – clearly.
1. People today use more electricity because technology has pervaded every aspect of life. 2. Several decades ago, electricity was mainly used to power a limited number of household items including lights, televisions and washing machines. 3. It still powers those devices but now there are phones to charge and computers that use electricity throughout the day. 4. People tend to spend more time at home, online with their devices thus using more power. 5. Even the large servers and generators required to power the internet add to the collective electric toll of modern technology.
Your topic sentence should clearly state your main idea for the whole paragraph.
Develop your main idea with specific detail.
Continue to develop. Don’t switch main ideas.
The more specific, the better!
Conclude your paragraph with more development or a result.
1. The best way to cultivate good energy habits is to impose regulations. 2. Government regulations have been a proven remedy in curbing human excess in terms of using plastic bags (bans) and smoking (taxes). 3. This would also work when it comes to energy. 4. One simple solution would be to tax energy use, though this step would have socioeconomic bias built into it. 5. A better approach might be to regulate the energy efficiency of household items. 6. This would target a high percentage of people across all classes and have an easily quantifiable, manageable outcome.
A new main idea for the second question.
Again, be as specific as possible developing the main idea.
Here I compare regulations in other industries to electricity.
I give my first solution here.
I conclude that there is an even better, related solution.
Conclude the paragraph again detailing why it is a good solution.
1. In conclusion, outsized energy consumption is down to technology and governments can regulate to minimise it moving forward. 2. The more effort put into reducing energy use, the more dividends future generations will reap from today’s reforms.
Repeat your opinion.
Add a final thought/extra detail at the end.
IELTS Vocabulary
For decades, warnings of incoming climate catastrophe have grown louder and many today are making concerted efforts to limit their carbon footprint. In my opinion, the main cause of over-consumption of electricity is the development of technology and people can be taught to limit their energy usage through strict governmental regulations.
People today use more electricity because technology has pervaded every aspect of life. Several decades ago, electricity was mainly used to power a limited number of household items including lights, televisions and washing machines. It still powers those devices but now there are phones to charge and computers that use electricity throughout the day. People tend to spend more time at home, online with their devices thus using more power. Even the large servers and generators required to power the internet add to the collective electric toll of modern technology.
The best way to cultivate good energy habits is to impose regulations. Government regulations have been a proven remedy in curbing human excess in terms of plastic bags (bans) and smoking (taxes). This would also work when it comes to energy. One simple solution would be to tax energy use, though this step would have socioeconomic biasbuilt into it. A better approach might be to regulate the energy efficiency of household items. This would target a high percentage of people across all classes and have an easily quantifiable, manageable outcome.
In conclusion, outsized energy consumption is down to technology and governments can regulate to minimise it moving forward. The more effort put into reducing energy use, the more dividends future generations will reap from today’s reforms.
Answers
warnings predictions
incoming climate catastrophe weather problems in the future
grown louder become more pressing
concerted efforts focused attempts
limit control
carbon footprint the amount of pollution your produce
over-consumption too much use
strict governmental regulations governments making laws to limit
pervaded throughout
aspect of life part of like
limited number not a lot
devices appliances
thus consequently
large servers computers that support the internet
generators produces electricity
collective electric toll altogether how much electricity it takes up
cultivate good energy habits make people more energy conscious
For decades, _______________ of _______________ have _______________ and many today are making _______________ to _______________ their _______________. In my opinion, the main cause of _______________ of electricity is the development of technology and people can be taught to limit their energy usage through _______________.
People today use more electricity because technology has _______________ every _______________. Several decades ago, electricity was mainly used to power a _______________ of household items including lights, televisions and washing machines. It still powers those _______________ but now there are phones to charge and computers that use electricity throughout the day. People tend to spend more time at home, online with their devices _______________ using more power. Even the _______________ and _______________ required to power the internet add to the _______________ of modern technology.
The best way to _______________ is to _______________. Government regulations have been a _______________ in _______________ in terms of plastic bags (_______________) and smoking (taxes). This would also work when it comes to energy. One simple solution would be to tax energy use, though this step would have ______________________________. A better approach might be to regulate the _______________ of household items. This would _______________ a high percentage of people _______________ and have an _______________, _______________.
In conclusion, _______________ is down to technology and governments can regulate to _______________ it moving forward. The more _______________ reducing energy use, the more _______________ future generations will _______________ from today’s _______________.
Listening Practice
Watch the video to review the sample answer above:
Student Sample Corrections
Environmentalists have
been voicing their concern for some time now[G1]. They
have pointed outpointing out that individuals should
curb their use of energy, which has been rising at an alarming rate. While the
main causes of this problem lie [G2] in
our over-reliance on technology, offering energy-efficient goods at a more
affordable price can beis a simple [G3] solution.
This IELTS Writing Task 2 Sample Answer Essay deals with taxes and whether or not individuals have any additional responsibilities towards society.
I think it is a (very rare!) interesting IELTS question!
Read below for my answer, analysis, vocabulary, practice and more!
Dave
If you are able, please consider supporting my efforts (and receiving exclusive IELTS Ebooks!) by signing up for my Patreon here.
IELTS Writing Task 2 Sample Answer Essay: Responsibility, Society, and Taxes (Real Past IELTS Tests)
Some people think that paying taxes is their only responsibility towards society while others feel that everyone should do more.
Discuss both views and give your own opinion.
Real Past IELTS Tests
Many are of the opinion that taxpayers are fulfilling their obligations to society at large while other feel that responsibilty extends beyond a financial contribution to the government. In my opinion, paying taxes greatly helps fund social programs but individuals have little choice but to do more if they also want to think highly of themselves.
The main reason that many see taxes as enough are the far reaching impact of tax dollars. Take some well-run European socialist countries such as France for example. In France, there are social welfare programs underpinning their progressive society such maternity leave for new mothers, world renowned unemployment benefits, top notch schools, not to mention more basic services like police, fire, and infrastructure maintanence. These are the direct result of taxes and though their net effect varies by implementation in various countries, they are clearly the foundation of stable societies globally.
Despite the discernible impact of taxes, individuals are responsible for their daily decisions related to society. Every job will touch on, with varying degrees of strength, society. A doctor who takes his job seriously, rather than simply trying to push new drugs or unnecessary tests to drive up premiums, helps families in their most dire situations. Even a cashier has a role to play. They can do their job responsibly with a positive attitude and send out other people into society with a good impression or contribute to the rising tide of cynisism in today’s culture. These actions are unavoidable and anyone who feels the need to think of themselves as a good person has no choice but to take up a larger role in making society a better place to live.
In conclusion, thought taxes are part of what a person owes to society, they will necessarily also have a positive or negative day to day impact. People should rightly see their contributions as essentially self-interested excuses to feel good about themselves.
Analysis
1. Many are of the opinion that taxpayers are fulfilling their obligations to society at large while other feel that responsibilty extends beyond a financial contribution to the government. 2. In my opinion, paying taxes greatly helps fund social programs but individuals have little choice but to do more if they also want to think highly of themselves.
Write a simple paraphrase of the topic. Don’t waste time on this sentence.
Give your opinion – be clear!
1. The main reason that many see taxes as enough are the far reaching impact of tax dollars. 2. Take some well-run European socialist countries such as France for example. 3. In France, there are social welfare programs underpinning their progressive society such maternity leave for new mothers, world renowned unemployment benefits, top notch schools, not to mention more basic services like police, fire, and infrastructure maintanence. 4. These are the direct result of taxes and though their net effect varies by implementation in various countries, they are clearly the foundation of stable societies globally.
Your topic sentence should have the topic (taxes) and your main idea (for me it is the impact of tax dollars).
Start your example right away!
Develop that same example. Be speficic and detailed for the rest of your paragraph.
Draw a conclusion/result to your example to conclude the paragraph.
1. Despite the discernible impact of taxes, individuals are responsible for their daily decisions related to society. 2. Every job will touch on, with varying degrees of strength, society. 3. A doctor who takes his job seriously, rather than simply trying to push new drugs or unnecessary tests to drive up premiums, helps families in their most dire situations. 4. Even a cashier has a role to play. 5. They can do their job responsibly with a positive attitude and send out other people into society with a good impression or contribute to the rising tide of cynisism in today’s culture. 6. These actions are unavoidable and anyone who feels the need to think of themselves as a good person has no choice but to take up a larger role in making society a better place to live.
Write another topic sentence – this time my main idea is that people make daily decisions that related to society beyond taxes.
Explain your main idea if necessary.
Here I use a hypothetical example – always have an example.
I switch to a related hypothetical example.
Then I develop those two examples.
Conclude your paragraph.
1. In conclusion, thought taxes are part of what a person owes to society, they will necessarily also have a positive or negative day to day impact. 2. People should rightly see their contributions as essentially self-interested excuses to feel good about themselves.
Restate your opinion.
Add in an extra detail or a final thought for full points for your task achievement score.
Vocabulary
Figure out what the words in bold below mean:
Many are of the opinion that taxpayers are fulfilling their obligations to society at large while other feel that responsibilty extends beyond a financial contribution to the government. In my opinion, paying taxes greatly helps fund social programs but individuals have little choice but to do more if they also want to think highly of themselves.
The main reason that many see taxes as enough are the far reaching impact of tax dollars. Take some well-run European socialist countries such as France for example. In France, there are social welfare programs underpinning their progressive society such maternity leave for new mothers, world renowned unemployment benefits, top notch schools, not to mention more basic services like police, fire, and infrastructure maintanence. These are the direct result of taxes and though their net effectvaries by implementation in various countries, they are clearly the foundation of stable societies globally.
Despite the discernible impact of taxes, individuals are responsible for their daily decisions related to society. Every job will touch on, with varying degrees of strength, society. A doctor who takes his job seriously, rather than simply trying to push new drugs or unnecessary tests to drive up premiums, helps families in their most dire situations. Even a cashier has a role to play. They can do their job responsibly with a positive attitude and send out other people into society with a good impression or contribute to the rising tide of cynisism in today’s culture. These actions are unavoidable and anyone who feels the need to think of themselves as a good person has no choice but to take up a larger role in making society a better place to live.
In conclusion, thought taxes are part of what a person owes to society, they will necessarily also have a positive or negative day to day impact. People should rightly see their contributions as essentially self-interested excuses to feel good about themselves.
Answers
fulfilling satisfying
obligations duties
society at large all of the world
extends beyond means more than
financial contribution money given
greatly a lot
fund social programs invest in social welfare
little choice but to must
think highly love
far reaching impact large impact
well-run efficient, good
socialist large government
social welfare programs support for the poor
underpinning serving as the foundation for
progressive society liberal
maternity leave time off for mothers
world renowned unemployment benefits money when you’re not working
top notch schools great schools
not to mention also
direct result clear impact from
net effectvaries by implementation different situations
stable societies globally well-rounded countries around the world
discernible impact clear effect
touch on relates to
varying degrees of strength stronger and weaker
takes his job seriously professional
push new drugs recommend pharmaceuticals
unnecessary tests uneeded testing
drive up premiums cost more for insurance
most dire situations worst contexts
responsibly dutifully
positive attitude good outlook
a good impression likeable
rising tide becoming more common
cynisism negative attitude
unavoidable can’t get around/away from
take up a larger role become more important
owes must pay back
day to day every day
rightly correctly
self-interested excuses justifications
Vocabulary Practice
Remember and fill in the blanks:
Many are of the opinion that taxpayers are ______________ their ______________ to ______________ while other feel that responsibilty ______________ a ______________ to the government. In my opinion, paying taxes ______________ helps ______________ but individuals have ______________ do more if they also want to ______________ of themselves.
The main reason that many see taxes as enough are the ______________ of tax dollars. Take some ______________ European ______________ countries such as France for example. In France, there are ______________ their ______________ such ______________ for new mothers, ______________, ______________, ______________ more basic services like police, fire, and infrastructure maintanence. These are the ______________ of taxes and though their______________ in various countries, they are clearly the foundation of ______________.
Despite the ______________ of taxes, individuals are responsible for their daily decisions related to society. Every job will ______________, with ______________, society. A doctor who ______________, rather than simply trying to ______________ or ______________ to______________, helps families in their ______________. Even a cashier has a role to play. They can do their job ______________ with a ______________ and send out other people into society with ______________ or contribute to the ______________ of ______________ in today’s culture. These actions are ______________ and anyone who feels the need to think of themselves as a good person has no choice but to ______________ in making society a better place to live.
In conclusion, thought taxes are part of what a person ______________ to society, they will necessarily also have a positive or negative______________ impact. People should ______________ see their contributions as essentially ______________ to feel good about themselves.
Nowadays because of digital technology it is possible for not only studios but also individuals to produce their own films.
Do you think this is a positive or negative development?
Real Past IELTS Tests January 18th 2020
The democratisation of film has led to greater opportunity as well as fears as to the future of filmmaking. In my opinion, this is a largely positive development as it opens up the medium for a more diverse range of socieconomic voices.
The main reason that film purists resist the digital revolution is it brings down the quality of films. A good example of this is when digital film first burst onto the scene and started to replace film around the turn of the century. The initial complaints from viewers were that film looks better and digitally shot movies have a cheap aesthetic akin to a soap opera. As digital film has proliferated beyond studios looking to cut costs, it has exponentially increased the number of films made by amateurs. This naturally leads to movies with bad acting, clumsily written dialogue and poor overall production values.
Despite the admitted cons listed above, digital film has given a voice to less wealthy filmmakers who tend to be of a different class and ethnicity. There are countless examples of students who film digitally, post their video on YouTube and become internet sensations. Many of these new perspectives are outside of the predominantly white, male, heterosexual homogenity of Hollywood. It is increasingly possible for LGBT themes to surface in these shorts and for ethnic minorities around the world to break through. The most striking evidence is simply comparing the major movies made 50 years ago with the diverse range of cinema on offer today.
In conclusion, although there are drawbacks in terms of quality those are mitigated by novel themes from underrepresented demographics. Studios should pay heed and relax their control over an ever-promising industry.
Analysis
1. The democratisation of film has led to greater opportunity as well as fears as to the future of filmmaking. 2. In my opinion, this is a largely positive development as it opens up the medium for a more diverse range of socieconomic voices.
Your first sentence just paraphrases the topic. You can write it simply or try to show off a bit if you are confident.
Give your opinion – never sit in the middle!
1. The main reason that film purists resist the digital revolution is it brings down the quality of films. 2. A good example of this is when digital film first burst onto the scene and started to replace film around the turn of the century. 3. The initial complaints from viewers were that film looks better and digitally shot movies have a cheap aesthetic akin to a soap opera. 4. As digital film has proliferated beyond studios looking to cut costs, it has exponentially increased the number of films made by amateurs. 5. This naturally leads to movies with bad acting, clumsily written dialogue and poor overall production values.
The first sentence should be a topic sentence with your main idea – for me it is the quality of films.
Start your example immediately – don’t waste any time!
Be as specific and detailed as you can. The more specific, the better.
Continue developing the same main idea, don’t switch to a new main idea.
Summarise with the result.
1. Despite the admitted cons listed above, digital film has given a voice to less wealthy filmmakers who tend to be of a different class and ethnicity. 2. There are countless examples of students who film digitally, post their video on YouTube and become internet sensations. 3. Many of these new perspectives are outside of the predominantly white, male, heterosexual homogenity of Hollywood. 4. It is increasingly possible for LGBT themes to surface in these shorts and for ethnic minorities around the world to break through. 5. The most striking evidence is simply comparing the major movies made 50 years ago with the diverse range of cinema on offer today.
Just like the paragraph before – clear topic sentence!
Again, start your example quickly and then develop it for the rest of the paragraph.
Being specific will help you to use really strong vocabulary like I did in this sentence.
The more detail and specificity, the higher your score.
The last sentence can add some further development. Don’t add in a new main idea here!
1. In conclusion, although there are drawbacks in terms of quality those are mitigated by novel themes from underrepresented demographics. 2. Studios should pay heed and relax their control over an ever-promising industry.
For your first sentence, summarise your opinion and main reason for it.
Add in an extra detail/final thought at the end.
Vocabulary
Try to figure out what the vocabulary in bold below means:
The democratisation of film has led to greater opportunity as well as fears as to the future of filmmaking. In my opinion, this is a largely positive development as it opens up the medium for a more diverse range of socieconomic voices.
The main reason that film purists resist the digital revolution is it brings down the quality of films. A good example of this is when digital film first burst onto the scene and started to replace film around the turn of the century. The initial complaints from viewers were that film looks better and digitally shot movies have a cheap aestheticakin to a soap opera. As digital film has proliferated beyond studios looking to cut costs, it has exponentially increased the number of films made by amateurs. This naturally leads to movies with bad acting, clumsily written dialogue and poor overall production values.
Despite the admitted cons listed above, digital film has given a voice to less wealthy filmmakers who tend to be of a different class and ethnicity. There are countless examples of students who film digitally, post their video on YouTube and become internet sensations. Many of these new perspectives are outside of the predominantly white, male, heterosexual homogenity of Hollywood. It is increasingly possible for LGBT themes to surface in these shorts and for ethnic minorities around the world to break through. The most striking evidence is simply comparing the major movies made 50 years ago with the diverse range of cinema on offer today.
In conclusion, although there are drawbacks in terms of quality those are mitigated by novel themes from underrepresented demographics. Studios should pay heed and relax their control over an ever-promising industry.
Answers
democratisation available to all
greater opportunity more chance to
largely positive development mostly good
opens up allows for
medium film
socieconomic voices opinions from different groups of people
film purists resist movie buffs don’t like
digital revolution ascent of digital filmmaking
brings down hurts
digital film movies shot with new cameras
burst onto the scene started
turn of the century around 2000
initial complaints first doubts
digitially shot movies movies shot on digital cameras
cheap aesthetic looks bad
akin to a the same as
soap opera melodramatic TV shows
proliferated beyond studios spread outside big companies
cut costs save money
exponentially increased gone up a lot
amateurs not professional
naturally of course
bad acting not good at acting
clumsily written dialogue poorly written script
poor overall production values cheaply made
admitted cons definite drawbacks
given a voice allowed to speak up
ethnicity race/ethnic group
countless examples many instances of
post put up
internet sensations popular on the web
new perspectives fresh voices
predominantly white, male, hetersexual homogenity of Hollywood film industry dominated by white straight men
increasingly possible more and more likely to happen
LGBT themes lesbian/gay/bi/trans undercurrents
surface come up
shorts short films
ethnic minorities small groups
break through become mainstream
most striking evidence obvious support
comparing contrasting
major movies studio films
diverse range lots of different types
on offer today available now
mitigated lessened
novel themes new ideas
underrepresented demographics not enough from these groups
pay heed pay attention to
relax their control allow others to do what they want
The ________________ of film has led to ________________ as well as fears as to the future of filmmaking. In my opinion, this is a ________________ as it ________________ the ________________ for a more diverse range of ________________.
The main reason that ________________ the ________________ is it ________________ the quality of films. A good example of this is when ________________ first ________________ and started to replace film around the ________________. The ________________ from viewers were that film looks better and ________________ have a ________________________________________________. As digital film has ________________ looking to ________________, it has ________________ the number of films made by ________________. This ________________ leads to movies with ________________ , ________________ and ________________.
Despite the ________________ listed above, digital film has ________________ to less wealthy filmmakers who tend to be of a different class and ________________. There are ________________ of students who film digitally, ________________ their video on YouTube and become ________________. Many of these ________________ are outside of the ________________, ________________. It is ________________ for ________________ to ________________ in these ________________ and for ________________ around the world to ________________. The ________________ is simply ________________ the ________________ made 50 years ago with the ________________ of cinema ________________.
In conclusion, although there are drawbacks in terms of quality those are ________________ by ________________ from ________________. Studios should ________________ and ________________ over an ________________.
Listening Practice
Listen and review the vocabulary and grammar from the sample answer:
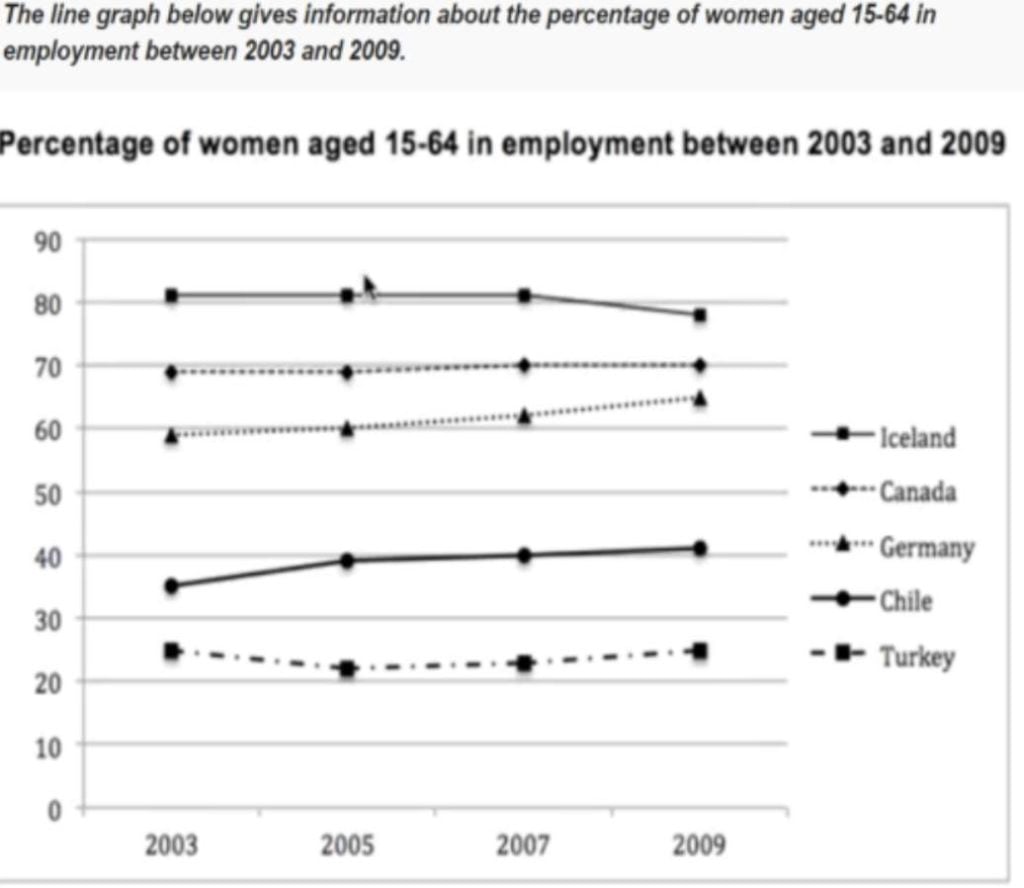
This is an IELTS writing task 1 sample answer related to the topic of female rates from the real past test.
You can find all the most recent questions from the test for writing hereand for speaking here.
This graph was drawn by a student and posted on Facebook – but it accurately reflects the real question from the test.
The most important detail is that this graph shows change over time and that impacts both your general overview and the vocabulary that you will use in your sample answer.
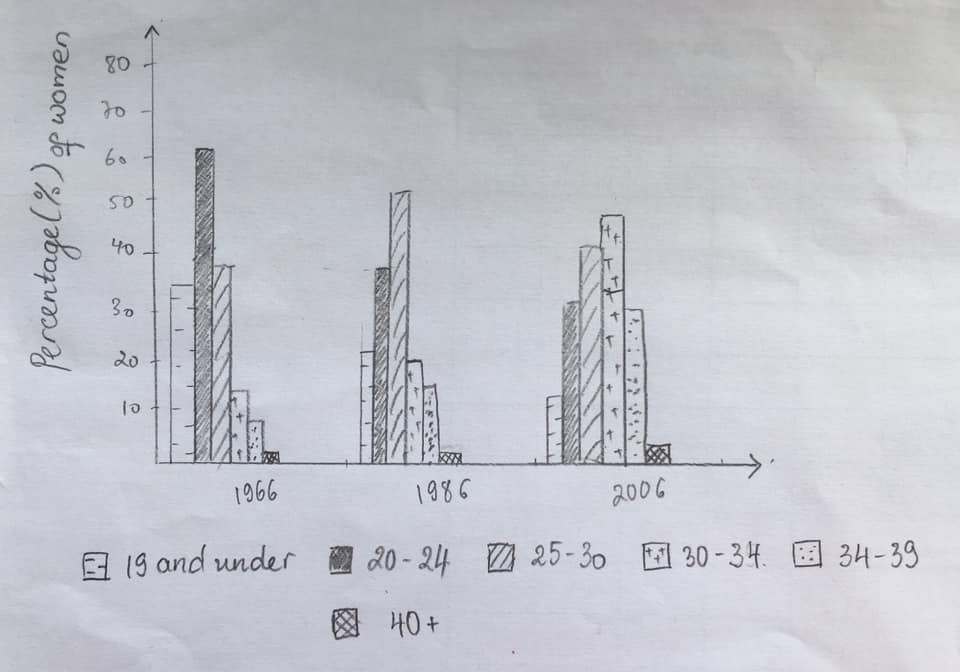
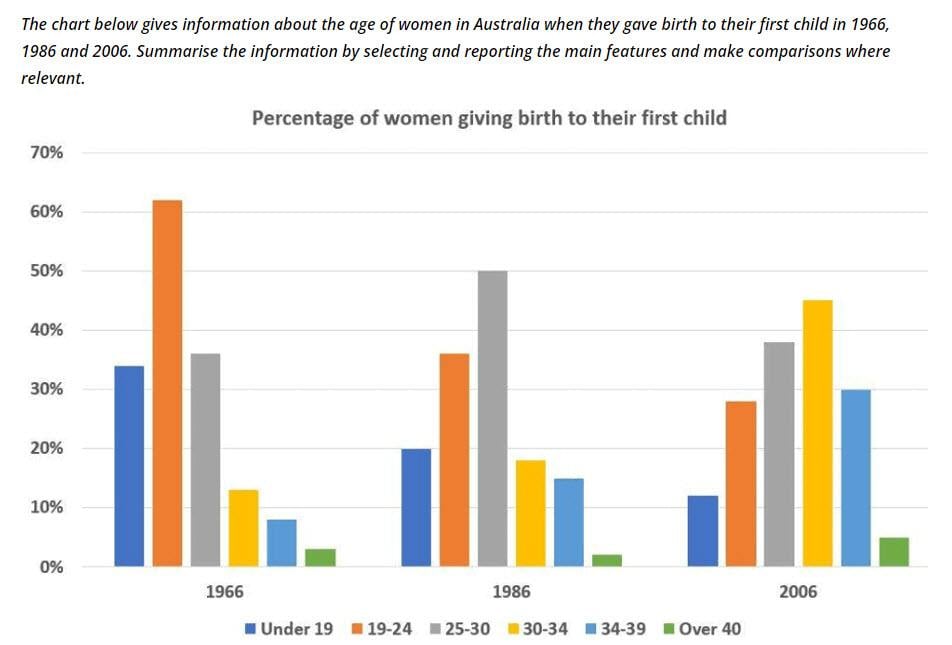
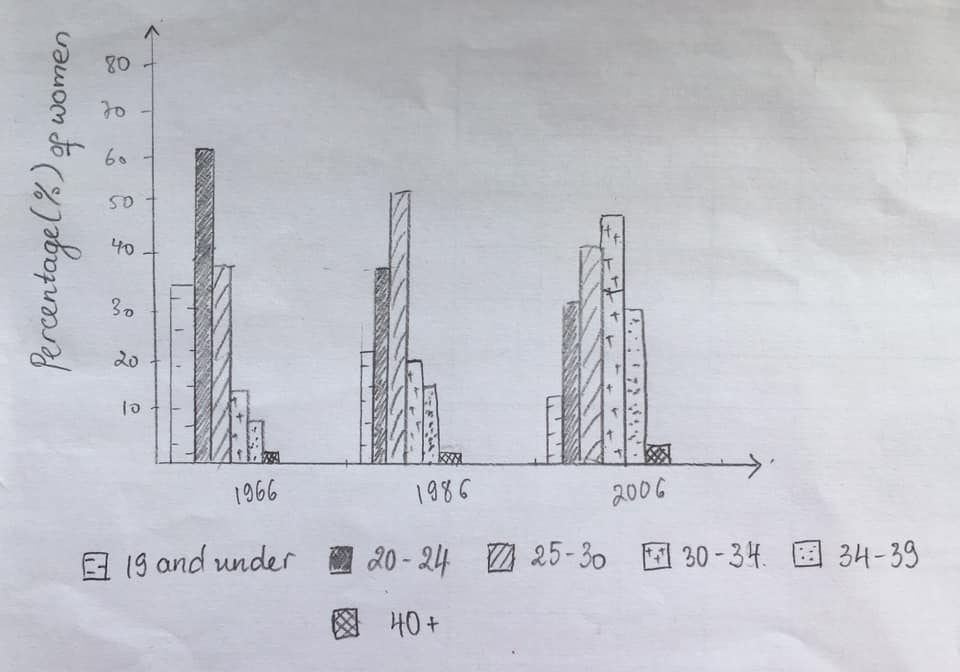
The chart below gives information about the age of women in Australia when they gave birth to their first child in 1966, 1986 and 2006.
Thanks for reporting it from the real test!
The given graph presents data comparing the ages when women in Australia gave birth in the years 1966, 1986, and 2006. Overall, birth rates for younger women fell while the number of women having children later in life increased greatly. Women aged 30-34 became the largest group and those with the fewest children were under 19 and over 40.
Looking first of all at younger women, both those under 19 and between 20 and 24 declined over the period. The first group started at around 33% in 1966 before falling to just over 20% in 1986 and ending at nearly 15% in 2006. The 20 to 24 group similarly halved from over 60% in 1966 (leading all ages then) to under 40% in 1986 and finishing at just above 30%.
Mothers aged 25 – 30 were the second highest demographic in 1966 (37%) before fluctuating to over 50% and back down to 42% by 2006. Women in the 30-34 age bracket increased more steadily from 12% to 19% and then surged to become the leader at 47%. 34 – 39 year olds generally mirrored this climb rising from 7% to 12% to 29%. In last position throughout was women aged 40+ who increased in proportion steadily but still made up less than 5% of total mothers.
Analysis
1. The given graph presents data comparing the ages when women in Australia gave birth in the years 1966, 1986, and 2006. 2. Overall, birth rates for younger women fell while the number of women having children later in life increased greatly. 3. Women aged 30-34 became the largest group and those with the fewest children were under 19 and over 40.
Your first sentence should simply paraphrase what the graph shows. This sentence is unimportant so write it fast!
This is the most important sentence you will write on all of IELTS. For this kind of graph, include the trend (up/down/stay the same) for all areas and some ranking/speed. Read more about overviews here.
1. Looking first of all at younger women, both those under 19 and between 20 and 24 declined over the period. 2. The first group started at around 33% in 1966 before falling to just over 20% in 1986 and ending at nearly 15% in 2006. 3. The 20 to 24 group similarly halved from over 60% in 1966 (leading all ages then) to under 40% in 1986 and finishing at just above 30%.
For this sentence I start to compare younger women. Make sure you have clear paragraphs and compare as much as possible!
The next sentence focuses on the specific data – include ALL the data!
Try to vary up your grammar and vocabulary as much as possible without sounding unnatural.
1. Mothers aged 25 – 30 were the second highest demographic in 1966 (37%) before fluctuating to over 50% and back down to 42% by 2006. 2. Women in the 30-34 age bracket increased more steadily from 12% to 19% and then surged to become the leader at 47%. 3. 34 – 39 year olds generally mirrored this climb rising from 7% to 12% to 29%. 4. In last position throughout was women aged 40+ who increased in proportion steadily but still made up less than 5% of total mothers.
Now compare the other parts of the chart/graph. For this one I now focus on older women.
Keep including all the data, varying your vocabulary and grammar.
You don’t have to include the years each time or it will be too repetitive.
Make sure that you don’t miss out on any of the categories even if they are minor!
Vocabulary
Try to figure out what the words in bold mean based on the sentences:
The given graph presents data comparing the ages when women in Australia gave birth in the years 1966, 1986, and 2006. Overall, birth rates for younger women fell while the number of women having children later in life increased greatly. Women aged 30-34 became the largest group and those with the fewest children were under 19 and over 40.
Looking first of all at younger women, both those under 19 and between 20 and 24 declined over the period. The first group started at around 33% in 1966 before falling to just over 20% in 1986 and ending at nearly 15% in 2006. The 20 to 24 group similarly halved from over 60% in 1966 (leading all ages then) to under 40% in 1986 and finishing at just above 30%.
Mothers aged 25 – 30 were the second highest demographic in 1966 (37%) before fluctuating to over 50% and back down to 42% by 2006. Women in the 30-34 age bracket increased more steadily from 12% to 19% and then surged to become the leader at 47%. 34 – 39 year olds generally mirrored this climb rising from 7% to 12% to 29%. In last position throughout was women aged 40+ who increased in proportion steadily but still made up less than 5% of total mothers.
The given graph ____________ data comparing the ages when women in Australia gave birth in the years 1966, 1986, and 2006. Overall, ____________ for younger women fell while the number of women having children ____________ increased ____________. Women aged 30-34 became the largest group and those with the fewest children were under 19 and over 40.
________________________ younger women, both those under 19 and between 20 and 24 ____________ over the period. The first group started at around 33% in 1966 before falling to ____________ 20% in 1986 and ____________ at ____________ 15% in 2006. The 20 to 24 group ____________ from over 60% in 1966 (leading all ages then) to under 40% in 1986 and ____________ at just above 30%.
Mothers aged 25 – 30 were the second highest ____________ in 1966 (37%) before ____________ to over 50% and back down to 42% by 2006. Women in the 30-34 age ____________ increased more steadily from 12% to 19% and then ____________ to become the leader at 47%. 34 – 39 year olds ____________ this climb rising from 7% to 12% to 29%. In ____________ throughout was women aged 40+ who increased in ____________ steadily but still ____________ less than 5% of total mothers.
These are the most recent/latest IELTS Writing Task 1 Task topics and questions starting in 2019, 2020, 2021, 2022, 2023, 2024, 2025, and continuing into 2026.
If you have already passed IELTS and are working on your college or university application essay, check out my post here.
You can find all the most recent IELTS writing task 2s here and the general training questions here.
If you are able, please consider supporting my efforts (and receiving exclusive IELTS Ebooks!) by signing up for my Patreon here.
Enjoy and comment any questions/writing that you have!
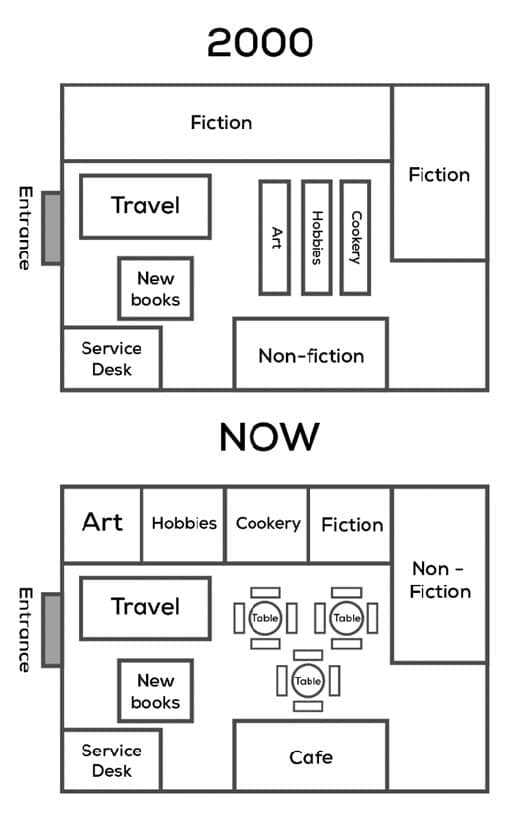
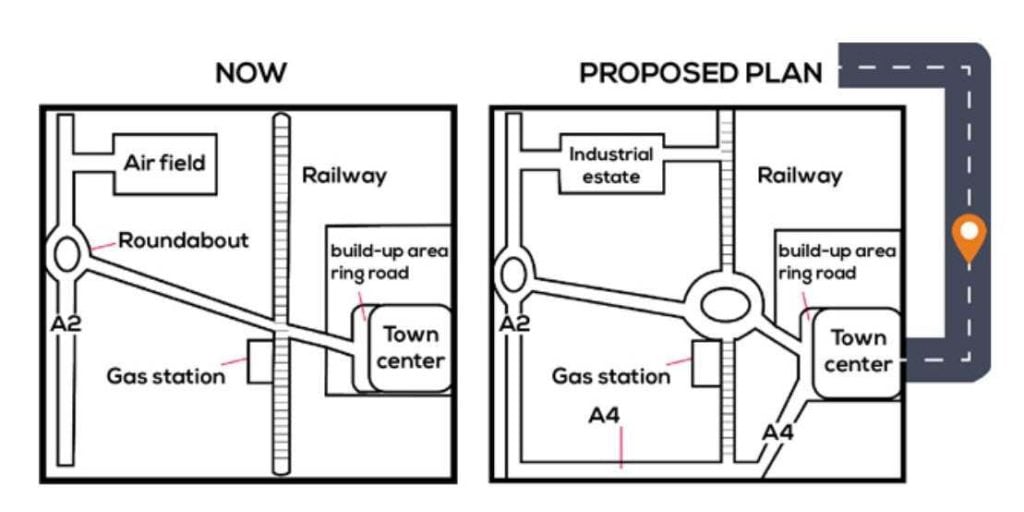
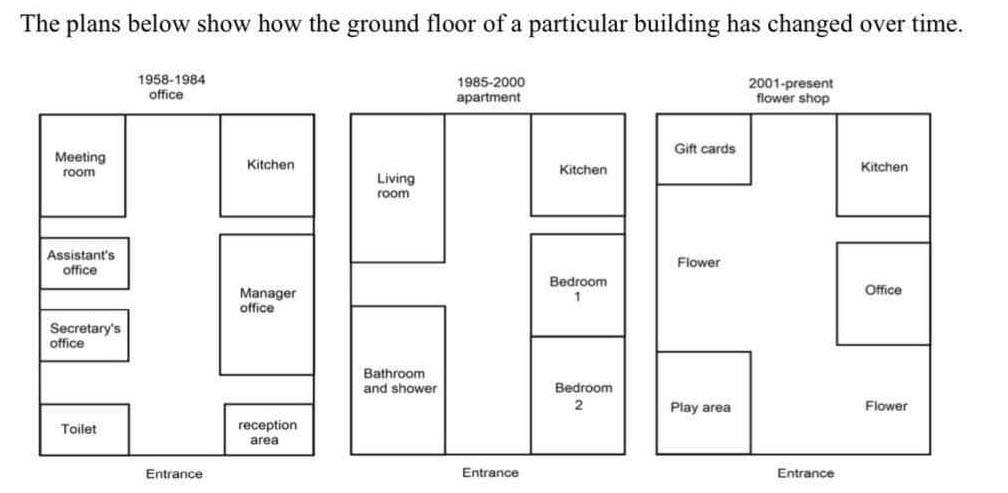
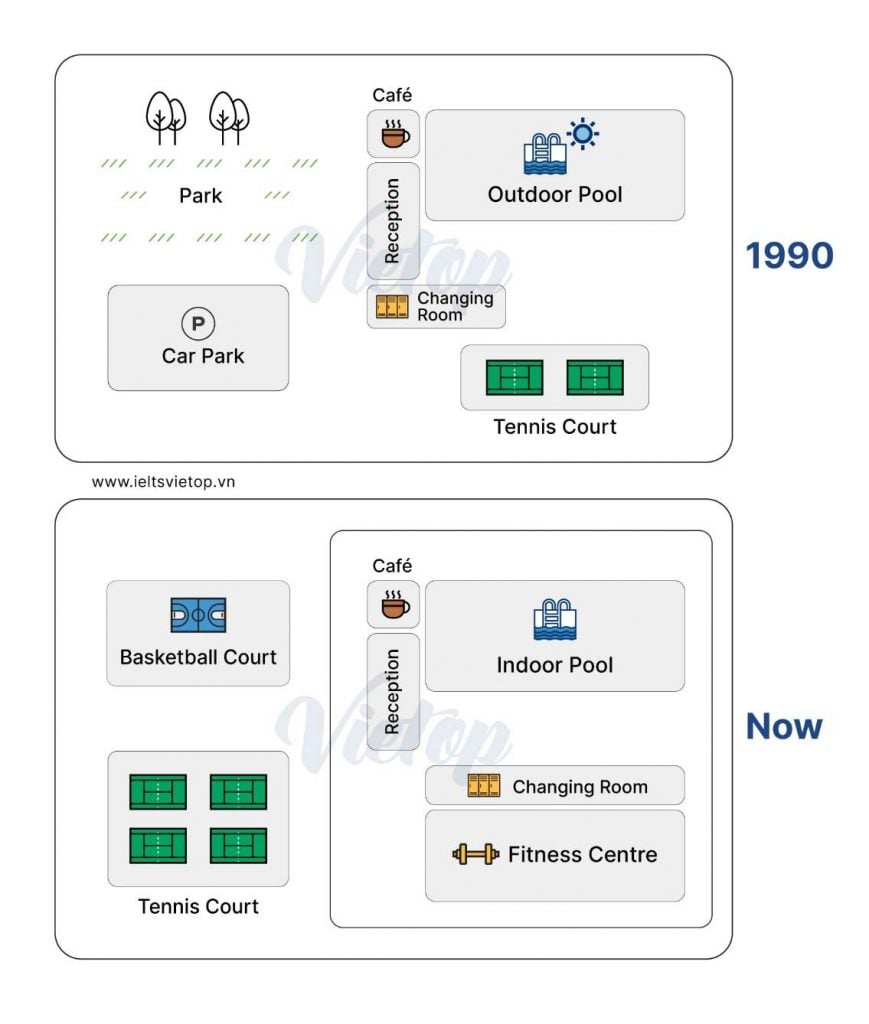
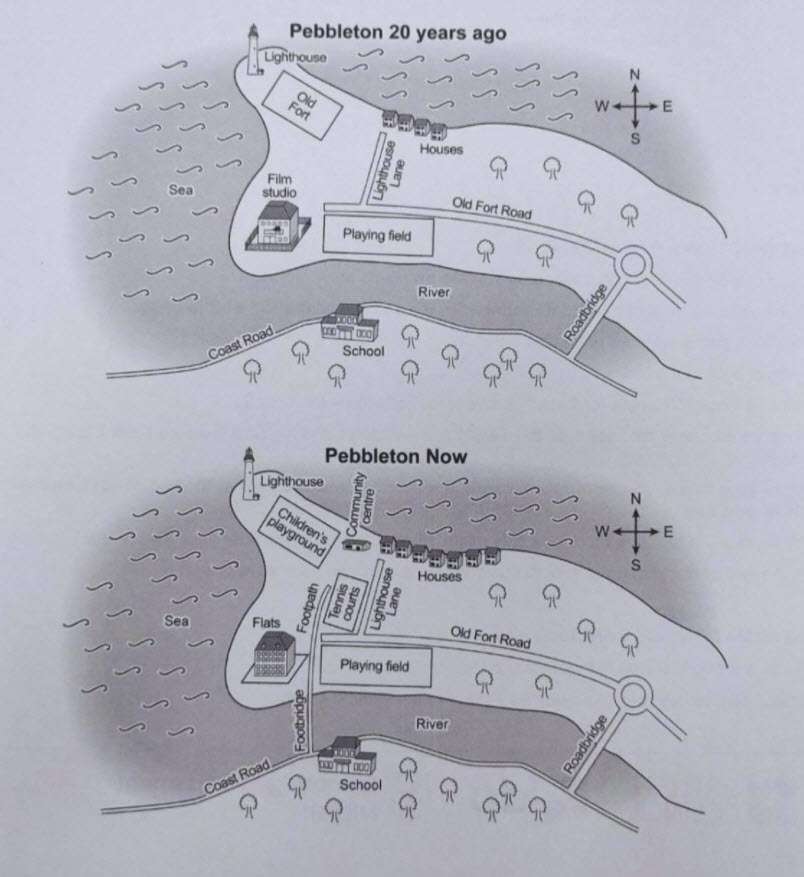
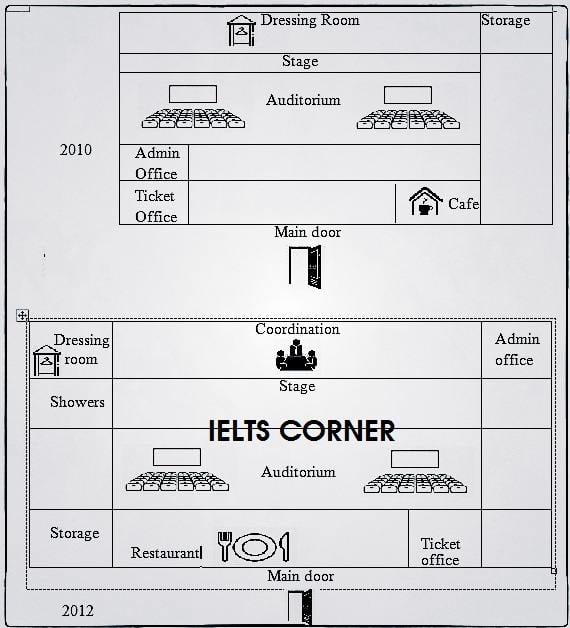
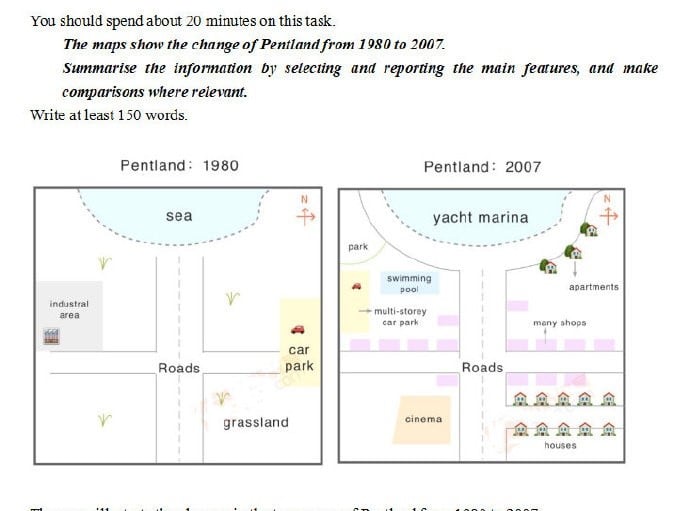
The plans below show a theatre in 2010 and 2012. Summarise the information by selecting and reporting the main features and making comparisons where relevant.Sample answer coming soon (I hope!) – write yours below for feedback!Sample answer coming soon! Post your own below for feedback from me!
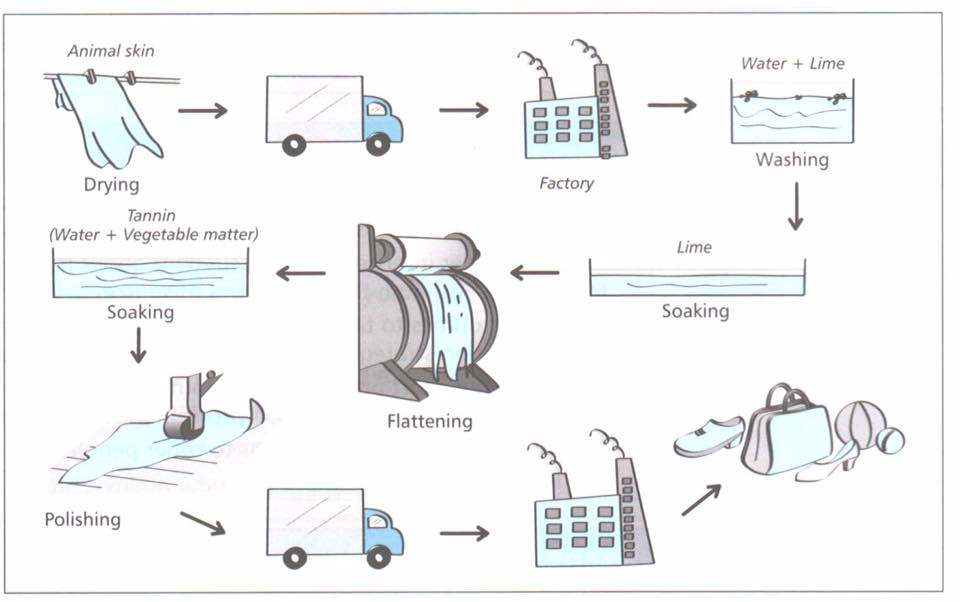
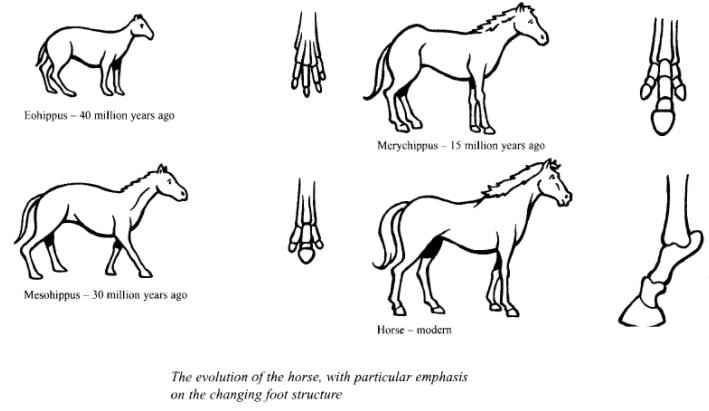
The diagrams below illustrate early tools from 1.4 million years ago and 800,000 years ago. Summarise the information by selecting and reporting the main features and making comparisons where relevant. Reported on IELTS December 7th
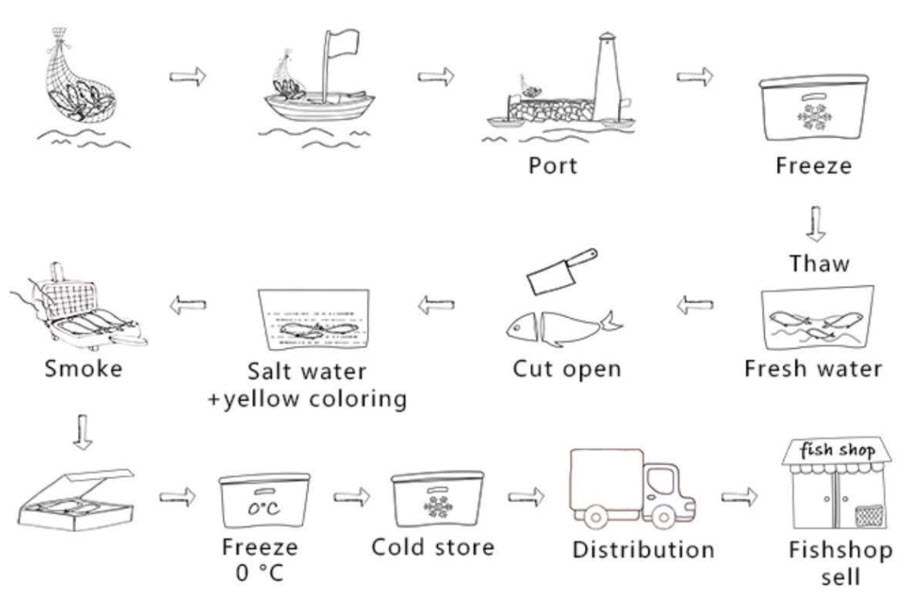
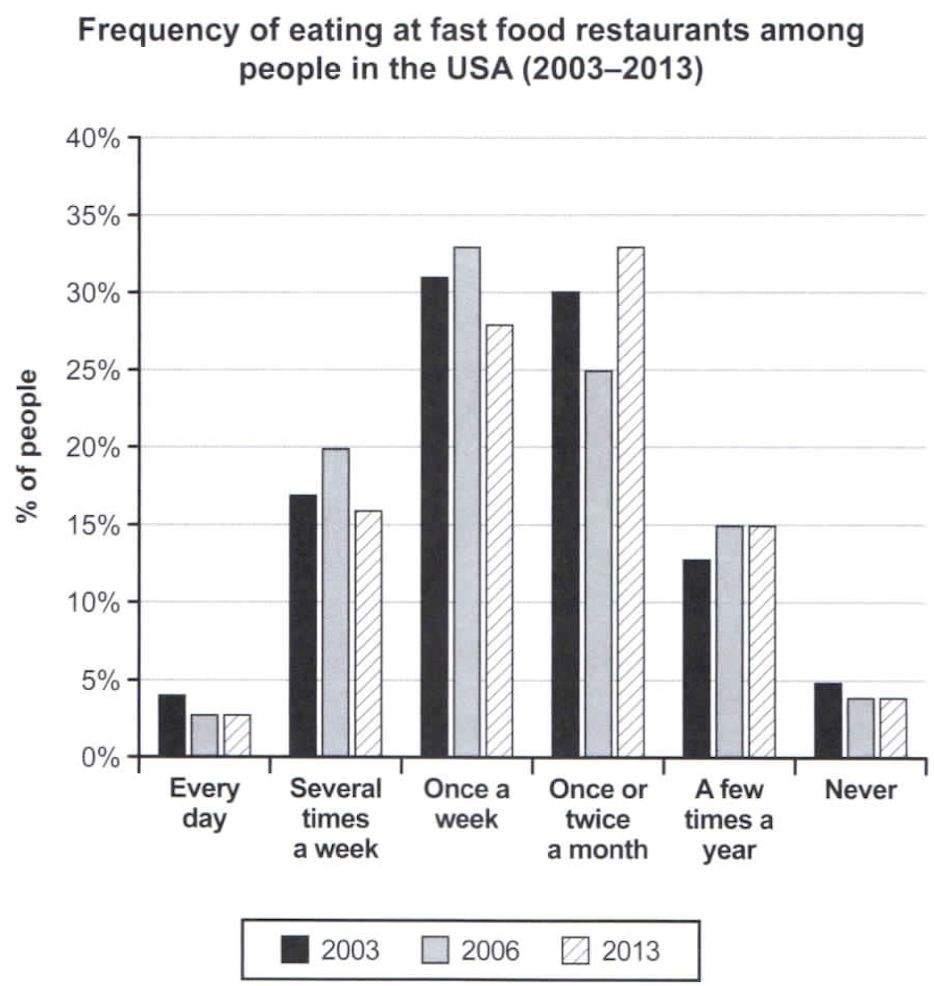
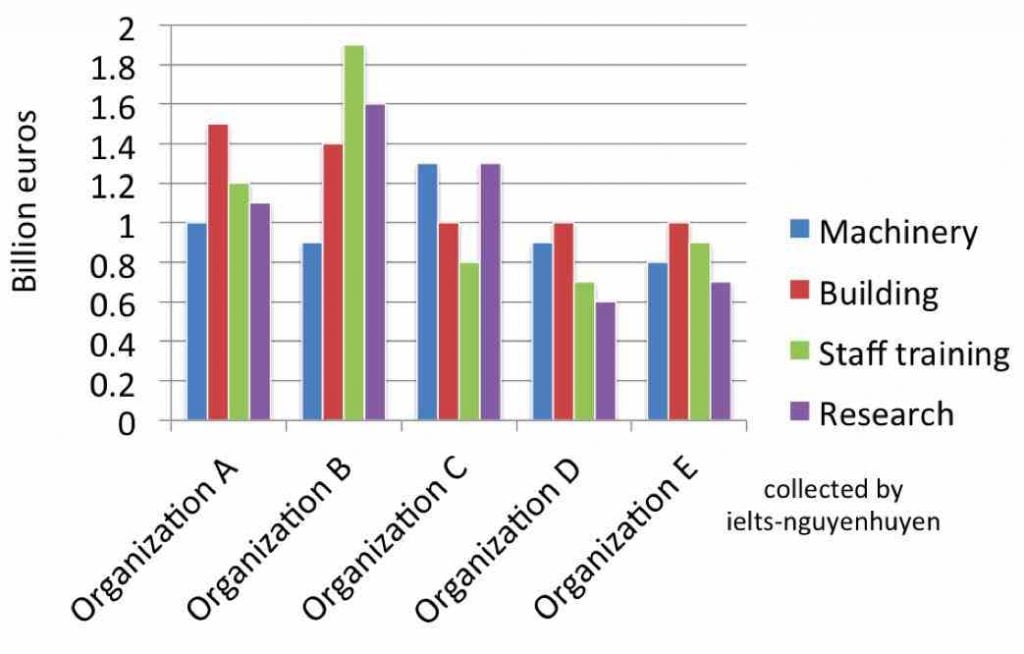
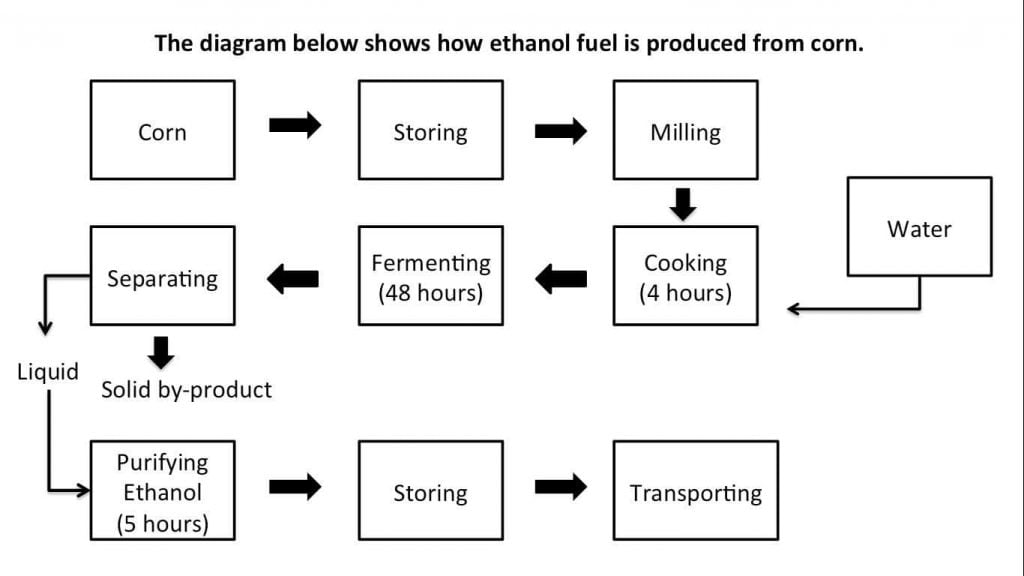
IELTS Exam Writing Task 1 Exam posted in IELTS Ngoc Bach by Nguyễn Huyền January 29th Read my sample answer for these charts here.IELTS Exam Writing Task 1 Process (Reported January 22nd to IELTS Ngoc Bach) IELTS Writing Task 1 Bar Chart (Reported January 17th on Facebook) Read my sample answer for this bar chart question here.Reported by students January 2020 Reported December 2019 by Vietop on Facebook
Reported December 2019 from IELTS with Datio
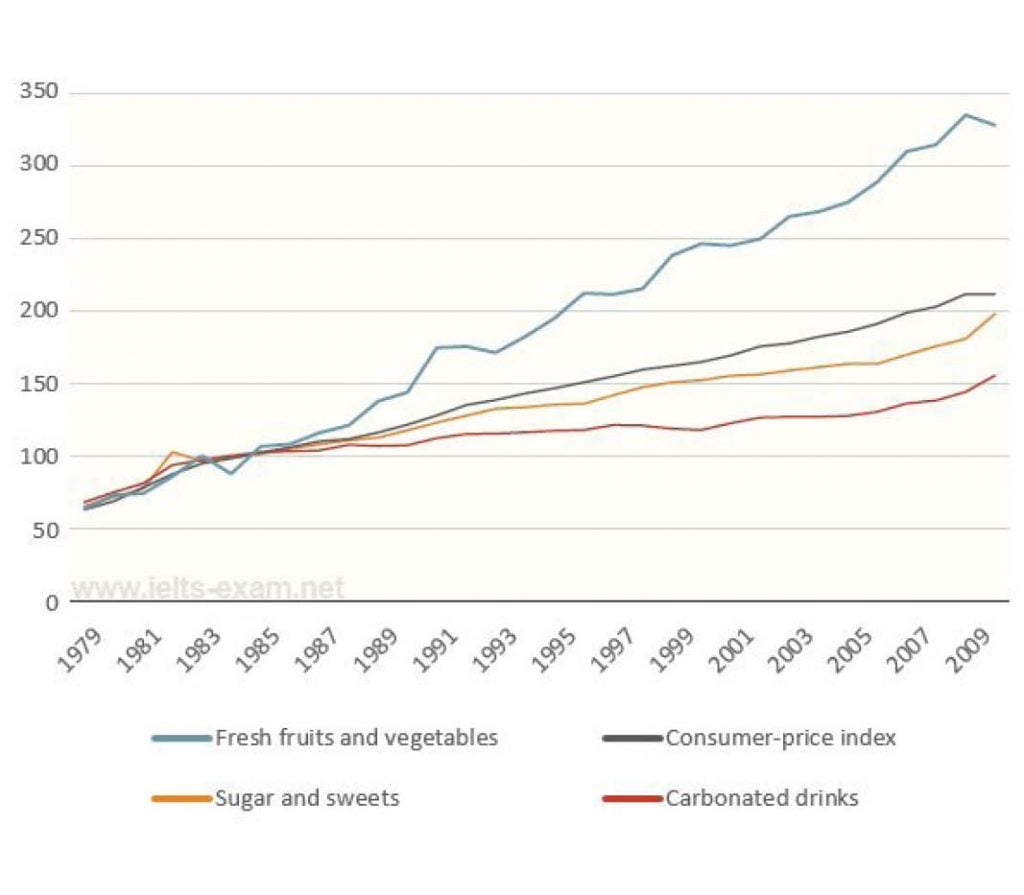
Reported November 2019 from ielts-exam.net
Reported November 2019Reported October 2019Reported August 2019Reported June 2019 from the IELTS Speaking and Writing Corner on Facebook
Reported December 2019
I want to make some simple suggestions for how you can use these recent graphs to practice.
To be honest, students get too obsessed with the most recent questions.
You can practice with a question from years ago and a question from yesterday – it makes absolutely no difference.
What makes an actual difference is how you study.
Here is what I recommend:
Practice writing about a graph in 20 minutes, in test conditions.
This is your ability. Now, check it by underlining the vocabulary, grammar, data. Are there many grammar mistakes? Do you use the same words over and over? Do you include all the data?
Now that you know your weaknesses, you can also sign up to have them marked by me here.
Write about another one focusing on your mistakes. Don’t worry about timing. Take as long as you need to make it perfect.
Repeat this process over and over until your start to notice your writing improving.
"The highest quality materials anywhere on the internet! Dave improved my writing and vocabulary so much. Really affordable options you don't want to miss out on!"